Why Are Auroras Different Colors? Green, Red and Purple
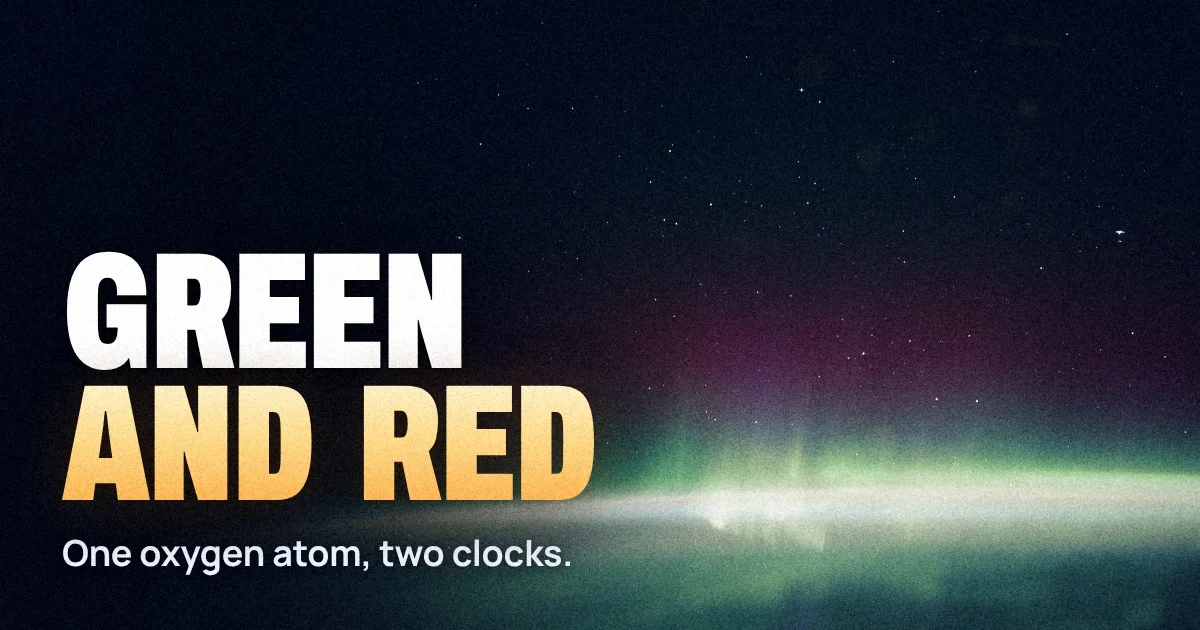
During the great storm of 10 and 11 May 2024, people in southern Europe, Florida and northern India posted photos of a sky glowing crimson and pink. In Norway, under the main oval, the same storm was a frenzy of green. Most explainers will tell you that green means oxygen and red means "higher up" or "nitrogen". Half of that is wrong, and the half that is right skips the actual reason.
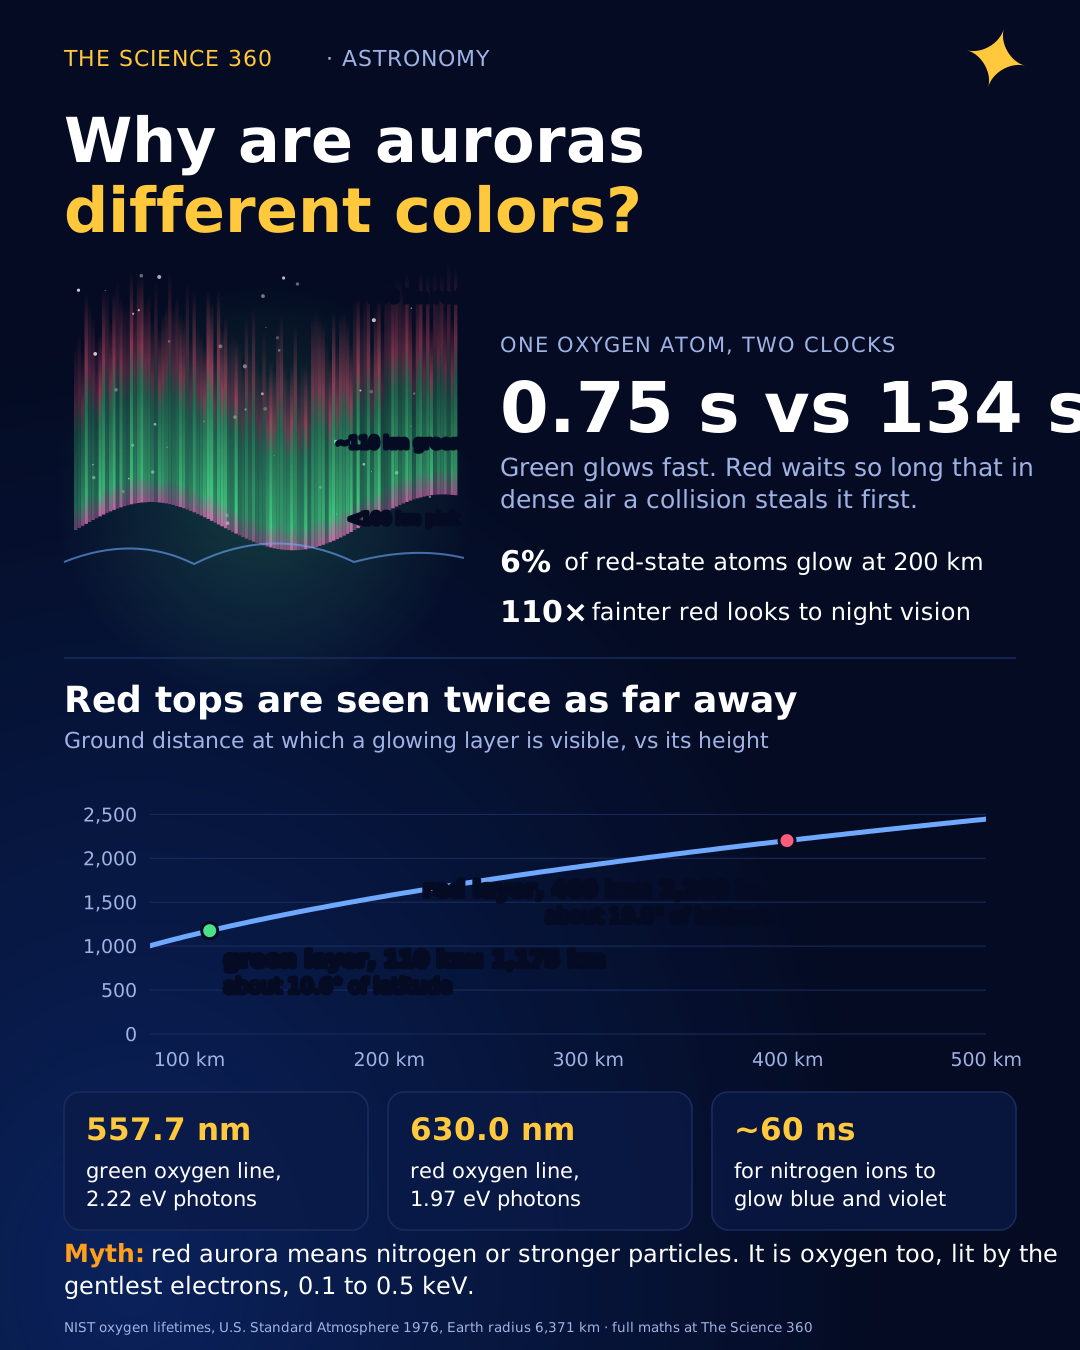
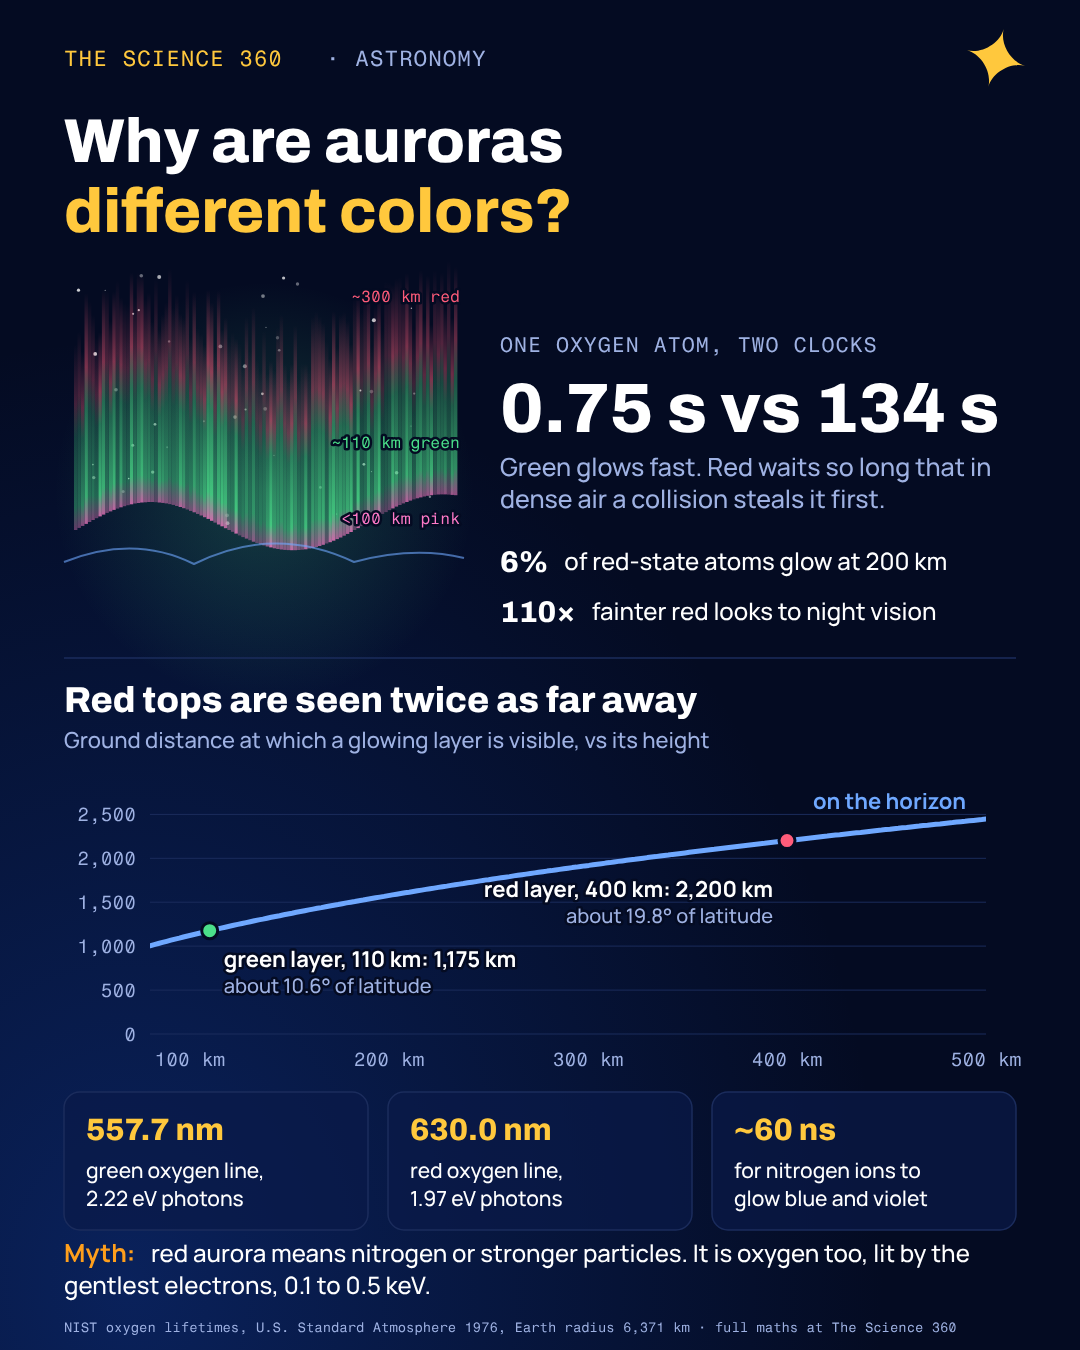
The green and the red both come from the same atom, atomic oxygen. What separates them is a stopwatch. An oxygen atom excited into the state that makes green light waits about three quarters of a second before it glows. An atom in the state that makes red light waits, on average, more than two minutes. Whether it ever gets to glow depends on how often it is bumped by its neighbours in the meantime, and that depends on altitude. That one idea explains the layering of colours in a curtain, why red auroras show up so far south, and why your phone sees colours your eyes do not.
What makes an aurora glow at all?
Auroras are powered by electrons, mostly with energies of a few hundred to a few tens of thousands of electronvolts, accelerated down along Earth's magnetic field lines into the upper atmosphere. Each fast electron makes hundreds of collisions on its way down. Some of those collisions knock bound electrons in oxygen and nitrogen into higher energy levels or rip them off entirely. When an excited atom or molecule drops back down, it emits a photon whose energy is fixed by the gap between the levels. That fixed energy is a fixed colour, which is why an auroral spectrum is a set of sharp lines rather than a smooth rainbow.
The three emissions that matter for what you see are in Figure 1. Two of them are oxygen: the green line at 557.7 nm and the red doublet at 630.0 and 636.4 nm. The third is ionised molecular nitrogen, N2+, with bands at 391.4 nm (violet) and 427.8 nm (blue). Neutral N2 adds a group of red bands between about 650 and 690 nm.
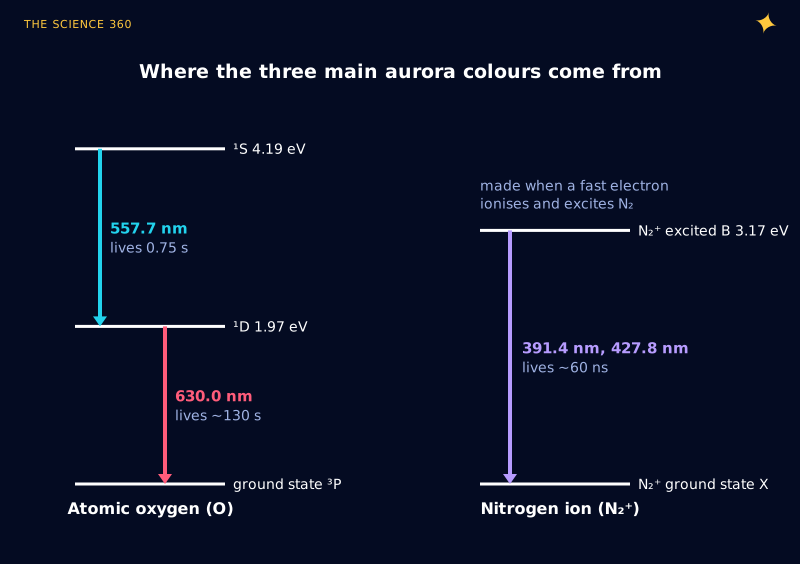
You can check the diagram with one line of arithmetic. A photon's energy in electronvolts is 1,239.8 divided by its wavelength in nanometres.
Photon energies of the oxygen lines
Sum: , the energy of the level above the ground state.
So the green line is the upper step of a two-step staircase and the red line is the lower step. An oxygen atom that emits green lands in the ¹D state and could then emit red too. Same atom, two colours.
Why does red aurora appear higher than green?
Both oxygen transitions are what physicists call forbidden: the quantum selection rules for ordinary dipole radiation do not allow them, so they happen only through much weaker processes. The NIST Atomic Spectra Database gives the transition probabilities. For the green line, , and with a small extra channel at 297.2 nm the ¹S state lives about 0.75 s. For the red lines, at 630.0 nm and 0.00182 per second at 636.4 nm, so the ¹D state lives about 134 s. (Older textbooks often say 110 s; the difference comes from which set of calculated transition probabilities you use.) For comparison, a normal allowed transition like the N2+ blue band takes tens of nanoseconds.
A long lifetime only matters if something can interrupt it. In the upper atmosphere that something is a collision with N2, O2 or another O atom, which can carry off the excitation energy as motion instead of light. This is called collisional quenching. The rate of collisions that quench ¹D oxygen is the gas density times a rate coefficient: for N2 the measured value is (Ravishankara and colleagues, 2002).
Will an excited red-line atom get to glow? (U.S. Standard Atmosphere 1976)
At 200 km ()
Quenching rate:
Radiative rate:
Fraction that emits:
At 120 km
Green line at 120 km
That is the whole story in one box. At 120 km a ¹D oxygen atom is hit about 13 times a second, so the chance that it survives the 134 seconds it needs is negligible: the red light is quenched. The green state, with its 0.75 s clock, barely notices. Go up to 300 km, where the air is several hundred times thinner than at 120 km, and about half of the red-state atoms get to emit. Figure 2 shows the full curves.
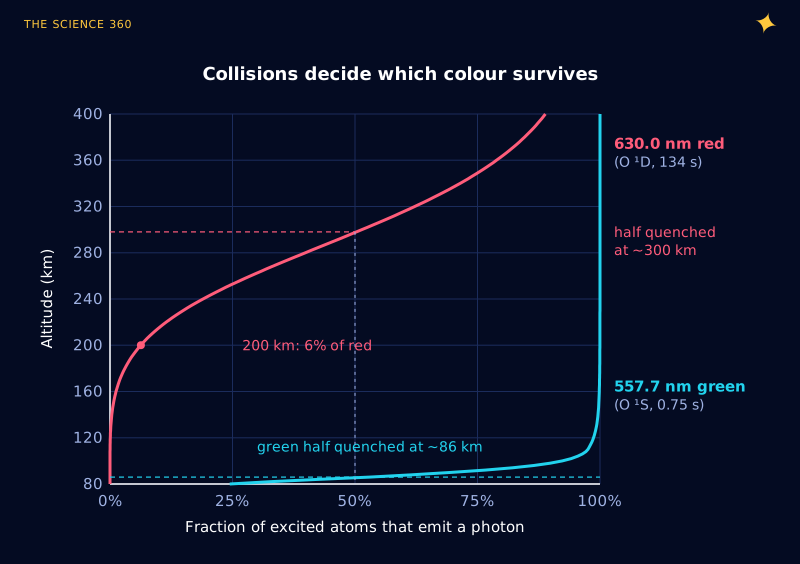
The emission you actually see also depends on how many atoms are excited, which falls with height as the air thins. Multiply a falling density by the rising curve in Figure 2 and red oxygen emission peaks broadly at roughly 200 to 300 km, while green peaks where the electrons deposit most of their energy, usually 100 to 150 km. That is why a tall auroral ray often runs green at the bottom and fades into dull red at the top.
The misconception: “red means nitrogen” or “red means more energetic”
Two errors come up constantly. The first is that red aurora comes from nitrogen. Nitrogen does emit some red (the N2 bands around 650 to 690 nm that colour the pink lower fringe), but the deep, high red glow that photographers chase is the oxygen 630.0 nm line.
The second is that red signals more powerful particles. It is roughly the reverse. To reach 100 km an electron needs about 10 keV. To stop at 200 km and above it must be soft, around 0.1 to 0.5 keV. Figure 3 shows the relationship, using the standard electron range in air and the 1976 standard atmosphere.
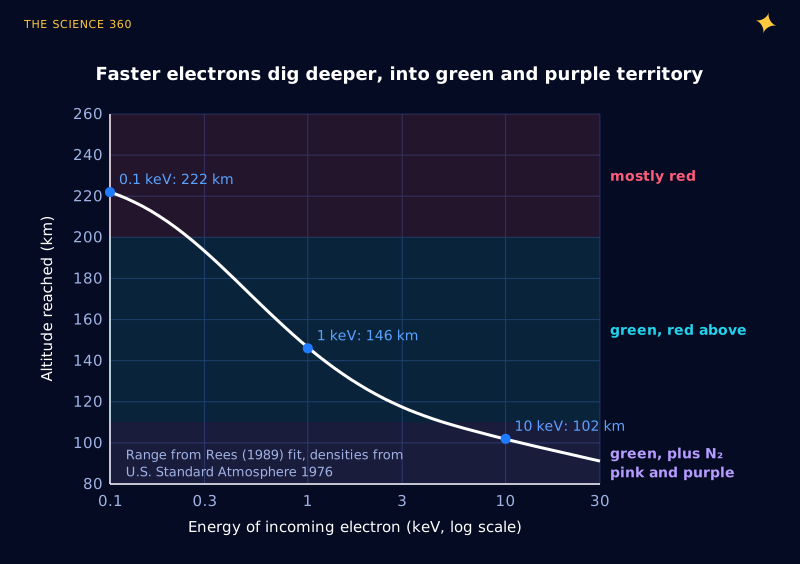
What big storms do is push the whole auroral oval toward the equator and pour in large fluxes of soft electrons, which light up the high red layer over a huge area. Storms also heat the upper atmosphere, which produces stable red arcs (often called SAR arcs) that are pure 630 nm, with almost no green. So a red sky over Italy is a sign of a big storm, but the individual electrons making the red are the gentle ones.
Where do blue, purple and pink come from?
Blue and violet come from N2+. An electron with enough energy can ionise an N2 molecule and leave the ion excited at the same time; the ion then emits at 391.4 or 427.8 nm within about 60 nanoseconds. No lifetime problem here, so these bands appear wherever energetic electrons hit nitrogen, which is everywhere along the path but most strongly low down, 90 to 110 km, where hard electrons dump their energy and nitrogen dominates.
Mix the blue-violet nitrogen ion light with red N2 bands and you get the magenta or pink fringe along the bottom of a fast-moving curtain. That fringe is a sign of unusually energetic electrons reaching below 100 km. Green oxygen still contributes there (Figure 2 shows the green state is not quenched until about 86 km), but atomic oxygen becomes scarcer than N2 as you go down, so nitrogen colours take over the lower edge.
There is one more source of blue. When an aurora extends high enough to be in sunlight while the ground is dark, N2+ ions at the top scatter sunlight resonantly at 391.4 and 427.8 nm. The result is a purple or blue top on tall rays, seen around twilight.
Why does an aurora look grey or pale green to the eye but colourful on a phone?
This is the question most people end up asking after a storm, and the answer is in your retina. In dim light, vision runs on rod cells, which do not distinguish colour at all and whose sensitivity peaks at 507 nm. The CIE scotopic (night vision) sensitivity curve, plotted in Figure 4, makes the problem obvious.
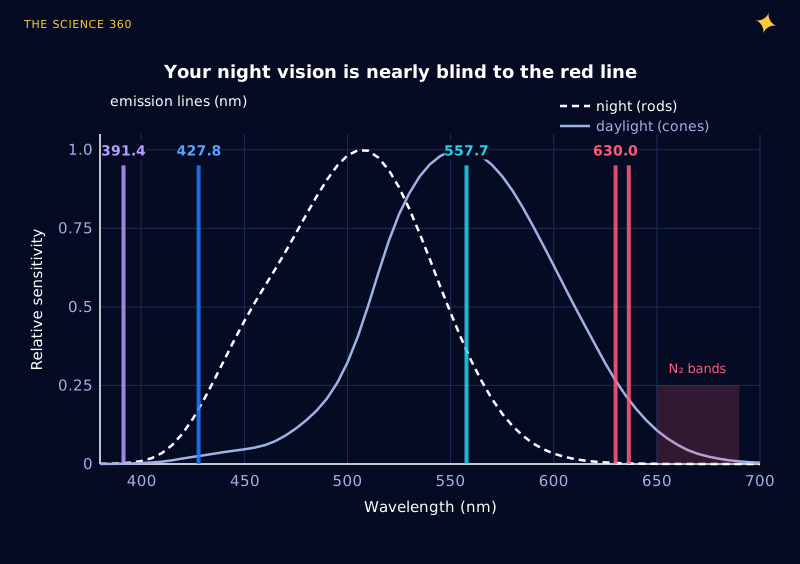
How much dimmer the red line looks at night
Scotopic sensitivity at 557.7 nm about 0.36 (interpolated between 0.402 at 555 nm and 0.329 at 560 nm); at 630 nm it is 0.0033.
In daylight vision (cones): .
To a dark-adapted eye, a red glow with the same power as a green one looks about 110 times fainter, and colourless. Bright aurora pushes your vision into the mesopic range where cones start working, which is why strong displays do look green and occasionally red. A phone camera has none of these limits. Its sensor integrates for seconds, keeps a colour filter on every pixel, and is quite sensitive in the red. It records the 630 nm glow your eye turned into a faint grey haze. Night-mode processing then boosts saturation, which is why social media aurora often looks more vivid than anything anyone saw.
Why do people far from the poles see red auroras?
Geometry. A glowing layer high above the ground stays above your horizon from farther away. Ignoring atmospheric refraction, an emission at height h is on the horizon for an observer at ground distance d:
Green layer, :
Red layer, :
At 111 km per degree of latitude: about 10.6° for green versus 19.8° for red.
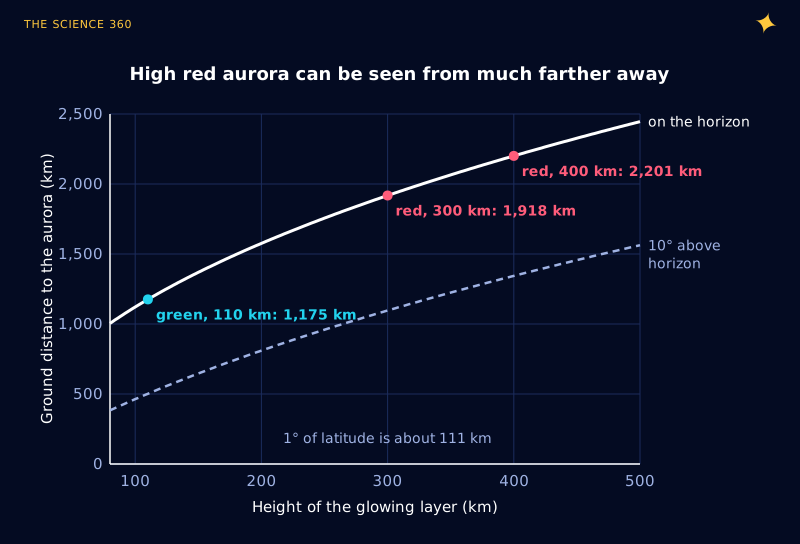
If the oval moves down to, say, 55° latitude during a storm, an observer at 40° to 45° sees nothing of the green base, which is below the horizon, but can see the red tops low in the north. That is why low-latitude aurora sightings are so often red, and why they hug the horizon.
Is now still a good time to see colourful auroras?
Solar Cycle 25 reached its maximum in late 2024: the 13-month smoothed sunspot number peaked at about 160.8 in October 2024, well above the official forecast of 115. As of late 2026 the cycle is in its declining phase, but that is not the end of the show. Some of the most intense storms of recent cycles came in the declining years, such as the Halloween storms of 2003, two to three years after the cycle 23 maximum. Large, fast eruptions and recurring high-speed solar wind streams both stay common for a few years after maximum, so the next couple of winters should still deliver red skies at middle latitudes now and then.
FAQ
What is the rarest aurora color?
Pure, bright red overhead and blue or violet are the least common to see with the naked eye. Red needs very high-altitude emission from low-energy electrons, which is common faintly but rarely bright, and the eye is poor at seeing red in the dark. Blue and violet from nitrogen ions are usually mixed with green and look purple or pink at the bottom edge of active curtains.
Why are most auroras green?
Most auroral energy is deposited by electrons of a few keV that stop at 100 to 150 km. There, excited oxygen atoms in the state that emits 557.7 nm green light live only about 0.75 seconds, short enough to radiate before a collision steals the energy. Your night vision is also far more sensitive at 557.7 nm than at the 630 nm red line.
Why do auroras look more colorful on a phone camera?
In dim light your eye switches to rod cells, which see no colour and are about 110 times less sensitive to the 630 nm red line than to the 557.7 nm green line. A camera sensor integrates light for seconds and keeps its colour response, so it records the red and purple that your eye renders as grey or faint green.
Why do people far from the poles see red auroras?
Red oxygen emission comes from 200 to 400 km up, so it stays above the horizon from much farther away than the green layer at about 110 km. An aurora at 400 km is visible on the horizon from about 2,200 km away, roughly 20 degrees of latitude, while green at 110 km is visible from about 1,200 km. Distant observers see only the red tops.
Related on The Science 360
Sources
- NIST Atomic Spectra Database, O I forbidden lines (A = 1.26 s−1 at 557.7 nm; 5.63 × 10⁻³ and 1.82 × 10⁻³ s−1 at 630.0 and 636.4 nm): physics.nist.gov/PhysRefData/ASD/lines_form.html
- A. R. Ravishankara et al., "Redetermination of the rate coefficient for the reaction of O(¹D) with N2", Geophysical Research Letters 29 (2002): esdpubs.nasa.gov/node/29956
- U.S. Standard Atmosphere 1976 (NASA-TM-X-74335), number densities and temperatures computed with the open-source ussa1976 Python package: ntrs.nasa.gov/citations/19770009539
- Colour and Vision Research Laboratory, CIE 1951 scotopic and Judd-Vos photopic luminous efficiency tables: cvrl.org/lumindex.htm
- Live Science, "Why are auroras different colors?": livescience.com
- UC Berkeley Space Sciences Laboratory, "Auroras: Paintings in the Sky, why are they different colors?": cse.ssl.berkeley.edu
- Wikipedia, "Solar cycle 25" (smoothed maximum about 160.8 in October 2024; 2019 panel forecast of 115): en.wikipedia.org/wiki/Solar_cycle_25
- NOAA Space Weather Prediction Center, solar cycle progression and news: spaceweather.gov
- M. H. Rees, Physics and Chemistry of the Upper Atmosphere, Cambridge University Press (1989), electron range-energy relation.
Method note: quenching fractions use NIST radiative rates, O(¹D) quenching by N2 (Ravishankara 2002), by O2 () and by O (8 × 10⁻¹², uncertain), and approximate O(¹S) quenching by O2 and O. Real thermospheric densities vary by a factor of several with solar activity, which moves the curves in Figure 2 up or down by tens of kilometres.
Header image: NASA (image iss072e159172), regraded for this article.