Universe Zoom Out: From an Astronaut to the Edge of the Observable Universe
Most pictures of "the scale of the universe" cheat. They put Earth, the Sun and a galaxy side by side as if they could share one frame, or they slip in a painting where a photograph should be. We wanted something stricter: one camera that starts beside a spacewalking astronaut and pulls back, smoothly, until the whole observable universe fits on your screen, with every object drawn at its real size and every picture a real image from a space agency or observatory.
The result is the Universe Zoom Out simulation. Scroll, drag, pinch or press Play and it walks through 17 stops. This article is the guide to that journey: what each stop shows, the numbers behind it, and the two facts that surprise almost everyone, namely how empty space is between stars and why the universe is wider than its age suggests.
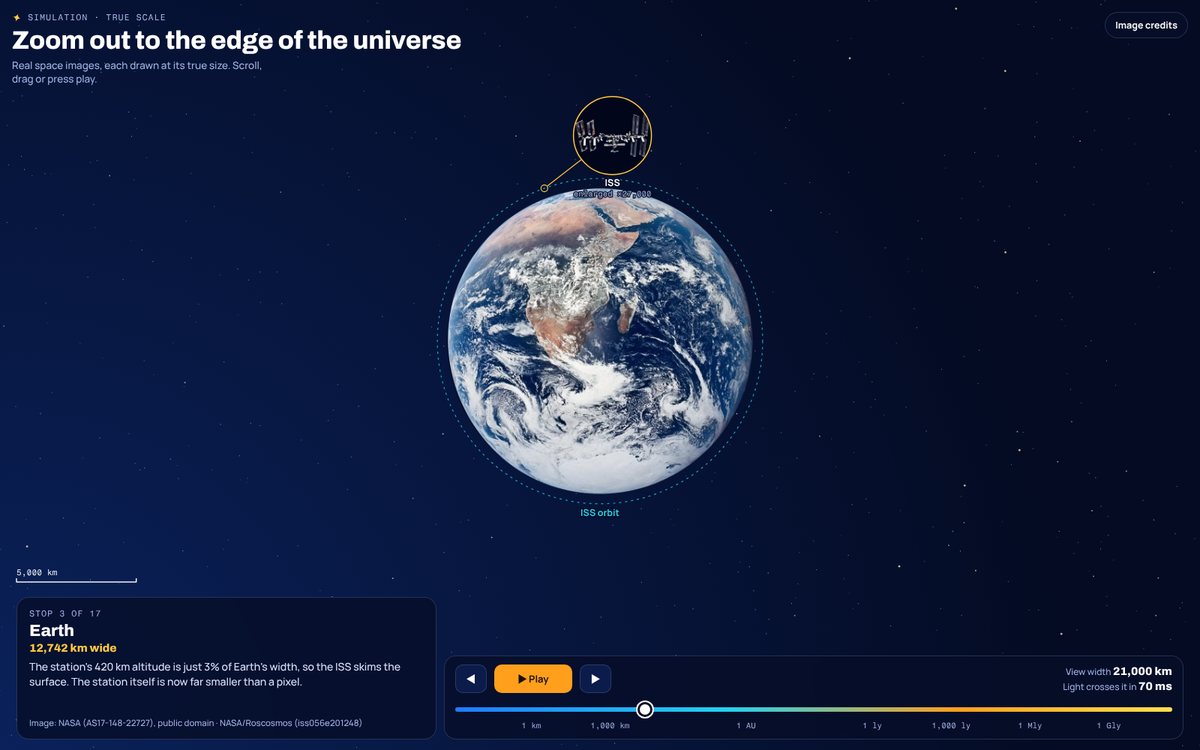
How the zoom works
Every object sits at a real position in one shared map, measured in metres, with the Sun at the centre. The camera's view width is set by the slider, which moves in powers of ten: the left end is about 2.5 m, the right end about 1027 m. Because the scale is shared, the zoom never resizes one object to make it look good next to another. When the ISS shrinks to less than a pixel next to Earth, that is the honest answer.
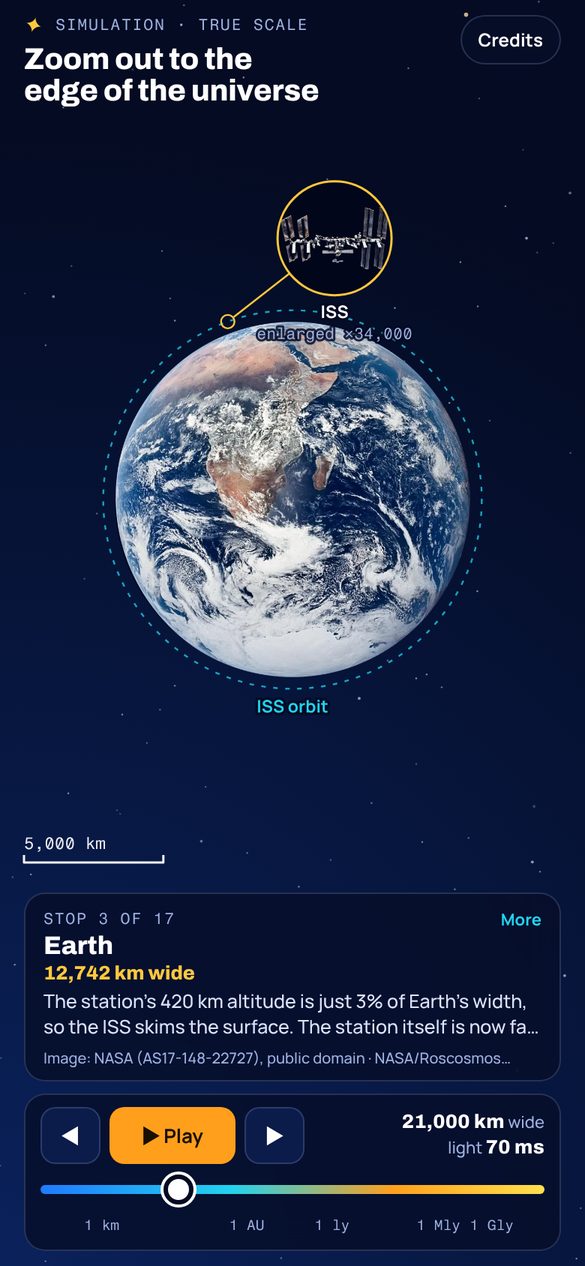
That honesty creates a problem: most of the interesting things become invisible almost immediately. So whenever an object is too small to see at a stop, the simulation draws a gold circle beside it with the real image enlarged, and labels the enlargement (at the Earth stop the ISS is shown 36,000 times larger than its true size). The dot it points to is where the object really is.
The second readout is the time light needs to cross the view, which is simply the width divided by the speed of light:
Light crosses Earth in 43 milliseconds, the Earth-Moon gap in 1.3 seconds, the Earth-Sun gap in 8 minutes 20 seconds and the Milky Way in about 100,000 years. Those times are a better ruler than kilometres once the numbers stop meaning anything.
Stops 1 and 2: an astronaut and the International Space Station
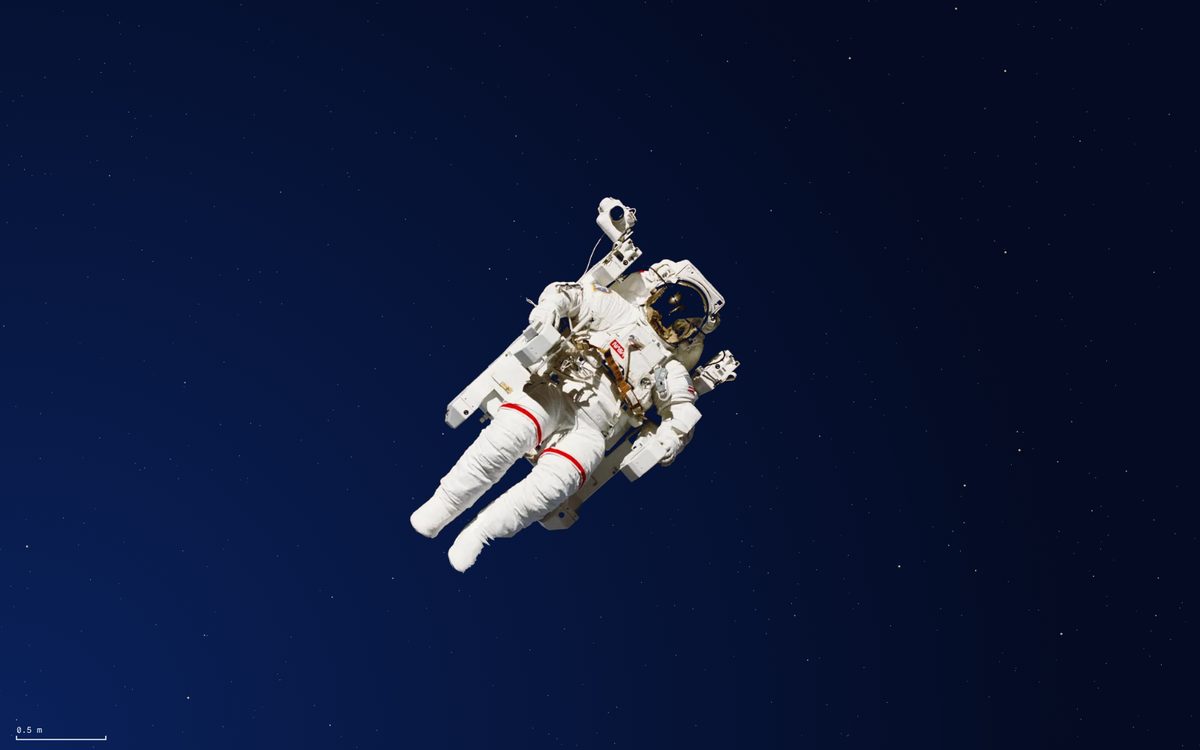
The journey starts at human scale. In February 1984, Bruce McCandless II flew the Manned Maneuvering Unit about 100 m away from the Space Shuttle Challenger with no tether at all, the first person to do so. In his suit and backpack he is about 2 m from helmet to boots. In the simulation he floats beside the International Space Station for scale; the photo itself was taken from the Shuttle.
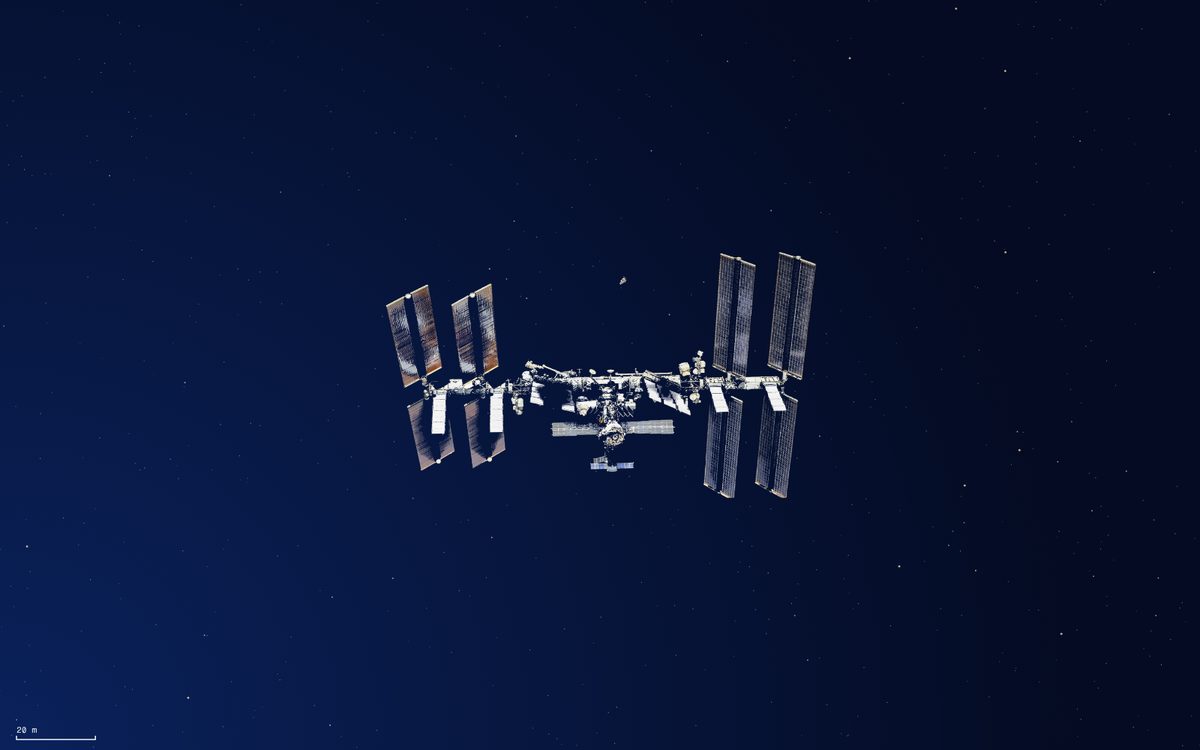
Zoom out by a factor of 55 and the whole station fits: 109 m across its main truss, about the length of an American football field including both end zones. It orbits roughly 420 km up at about 7.7 km/s, once every 92 minutes. If you have ever wondered why astronauts float when Earth's gravity at that height is still nearly full strength, we worked it out in Is there gravity on the ISS?
Stops 3 and 4: Earth and the Moon’s orbit
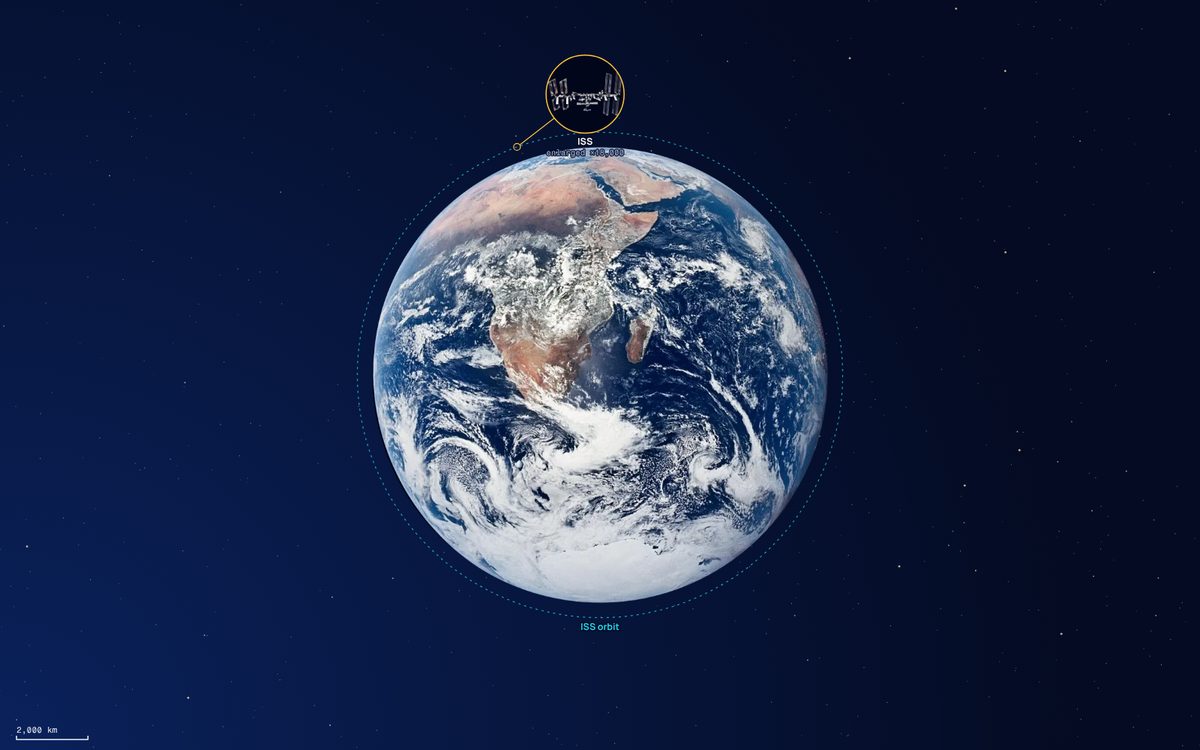
The next jump is the biggest of the early ones: a factor of about 117,000. Earth is 12,742 km wide, and from this distance the station's orbit almost touches the surface. 420 km is about 3% of Earth's diameter, roughly the thickness of the skin on an apple. The Earth image is the Blue Marble, taken by the Apollo 17 crew on 7 December 1972 on their way to the Moon.
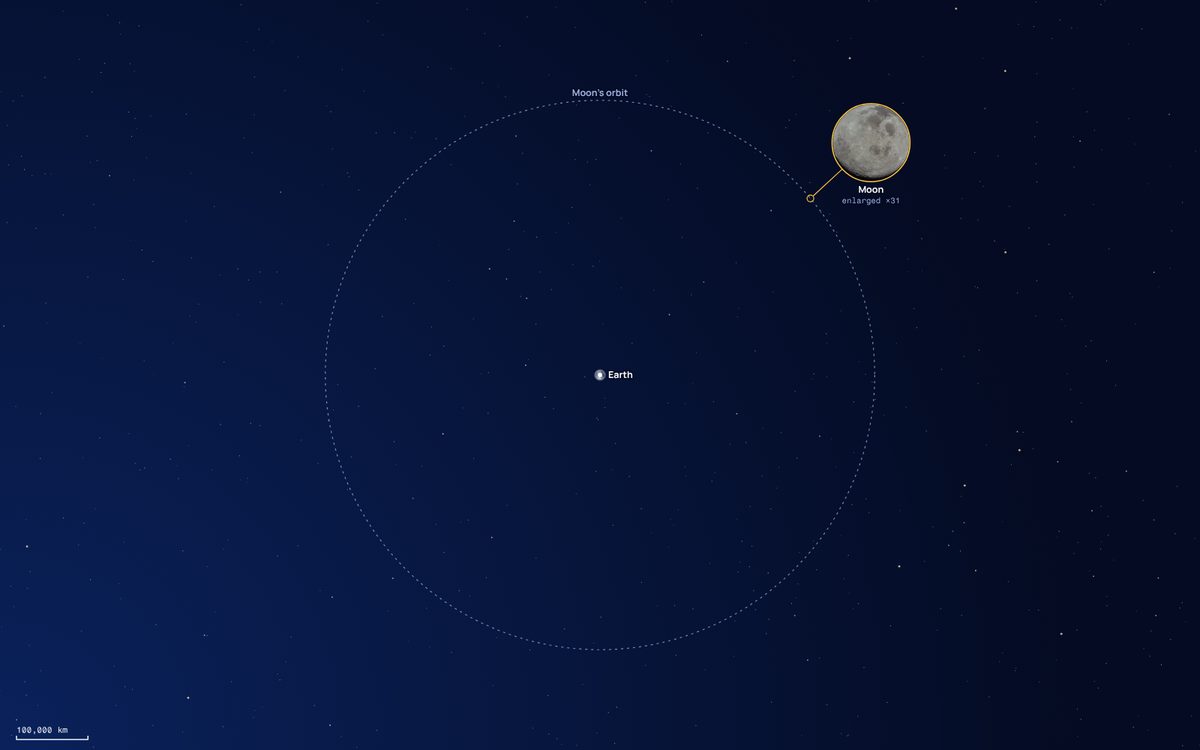
The Moon averages 384,400 km from Earth, about 30 Earth widths. Only a few dozen people, the Apollo crews and the Artemis II crew, have ever travelled out to that circle. Light makes the trip in 1.3 seconds.
Stops 5 to 7: the Sun, the planets and Voyager 1
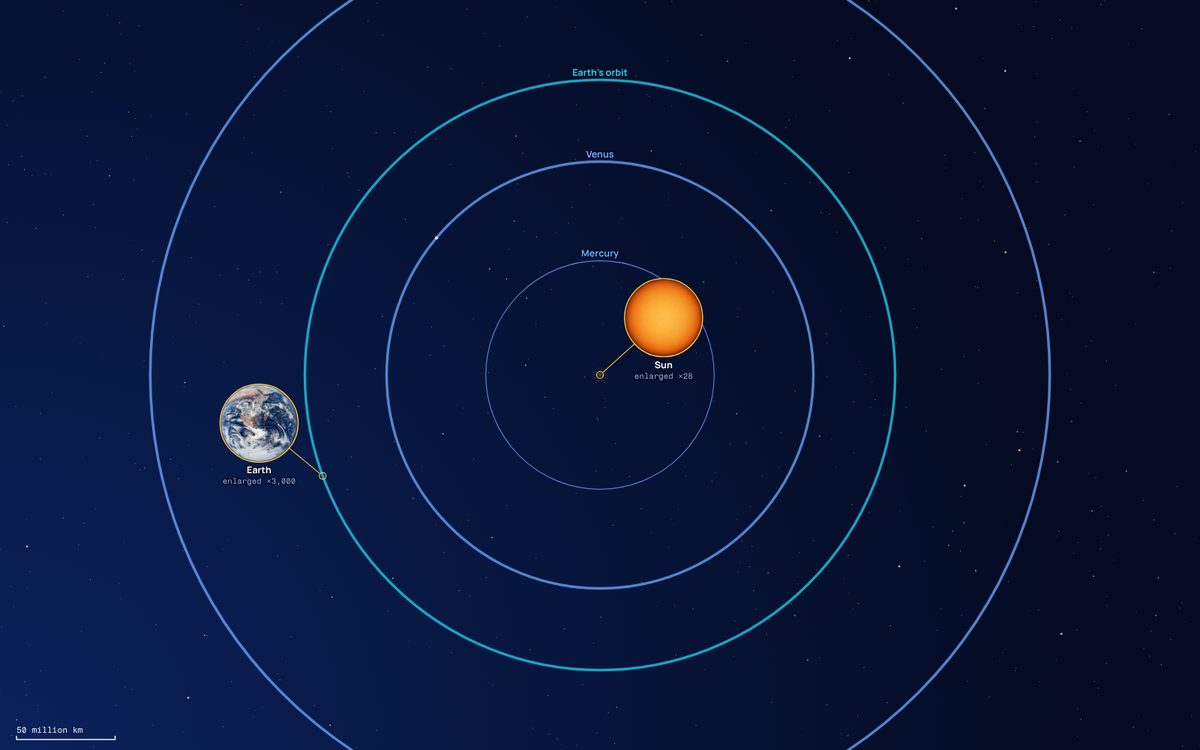
Earth sits 150 million km from the Sun, one astronomical unit (AU). Sunlight takes 8 minutes 20 seconds to arrive. The Sun is 1.39 million km wide, 109 times Earth, yet at this zoom it is a speck. The image is a visible-light picture from NASA's Solar Dynamics Observatory, tinted orange; the Sun's real colour is closer to white, as we explain in What colour is the Sun?
Pull back to 60 AU and Neptune's orbit fits on screen. Every planet is now far smaller than one pixel, so the dots in the simulation are markers, not pictures. While you read this, Earth is carrying you around that orbit at about 30 km/s (how fast Earth is really moving).
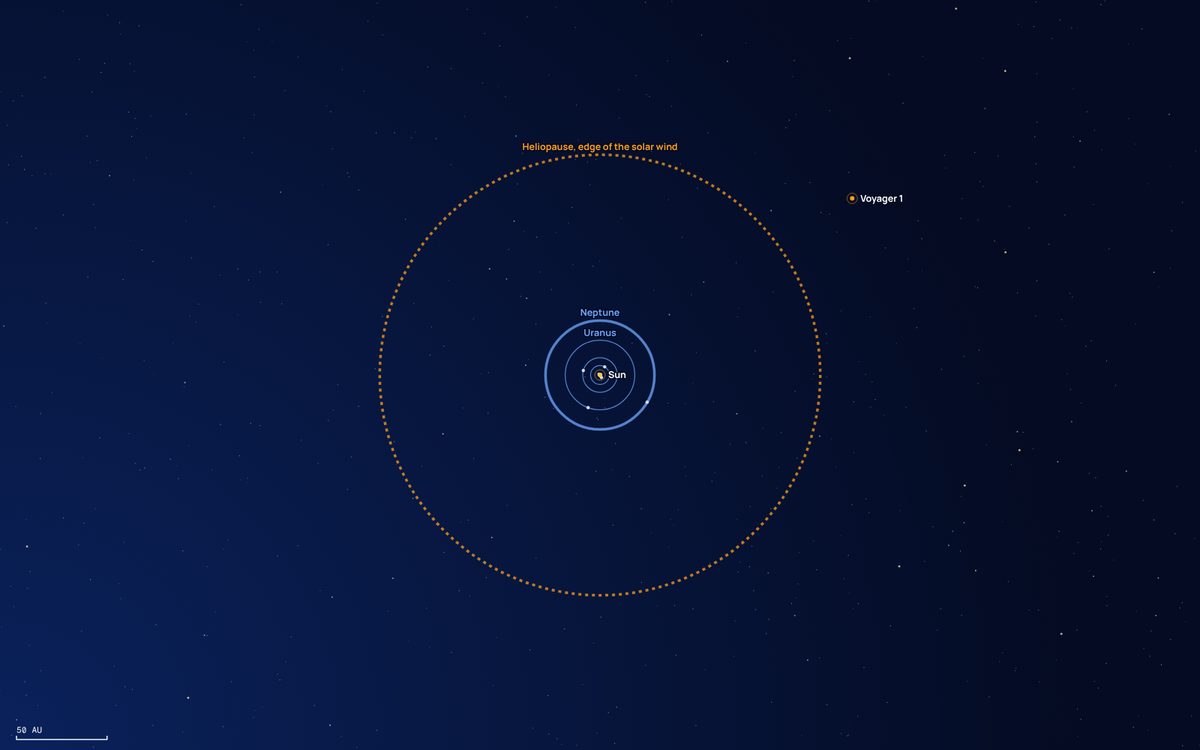
Voyager 1, launched in 1977, is the farthest spacecraft from Earth, about 170 AU from the Sun. It crossed the heliopause in August 2012 at about 121 AU, and around late 2026 it becomes the first spacecraft one light-day from Earth. Further out still, the simulation shades the Oort cloud: a thin shell of icy bodies thought to begin a few thousand AU out and stretch to perhaps 100,000 AU, more than a light-year. Nobody has seen it directly; long-period comets are the evidence.
Stop 9: the nearest stars, and how empty space really is
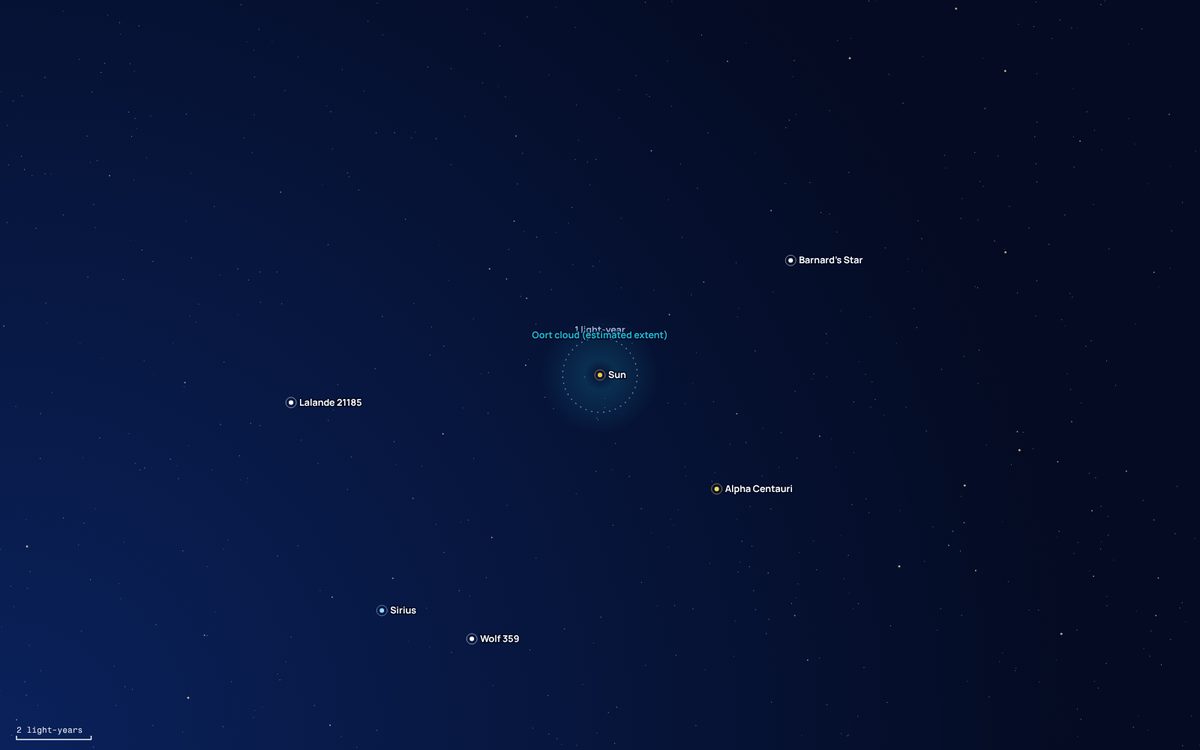
Alpha Centauri, the nearest star system, is 4.37 light-years away (its small red dwarf, Proxima Centauri, is slightly closer at 4.24). Barnard's Star is at 5.96, Wolf 359 at 7.86, Lalande 21185 at 8.31 and Sirius at 8.60 light-years. We measure those distances with parallax, the tiny shift of a star against the background as Earth orbits; see how far away are the stars.
This is where the emptiness hits. Scale the Sun down to a 1 cm marble and see where everything lands:
The Sun as a 1 cm marble
A marble in London and the next marble near Paris, with almost nothing between them. Stars are separated by about 30 million of their own widths. At Voyager 1's speed of about 17 km/s, the trip to Alpha Centauri would take about 77,000 years.
Stops 10 and 11: the Orion Nebula and the Pillars of Creation
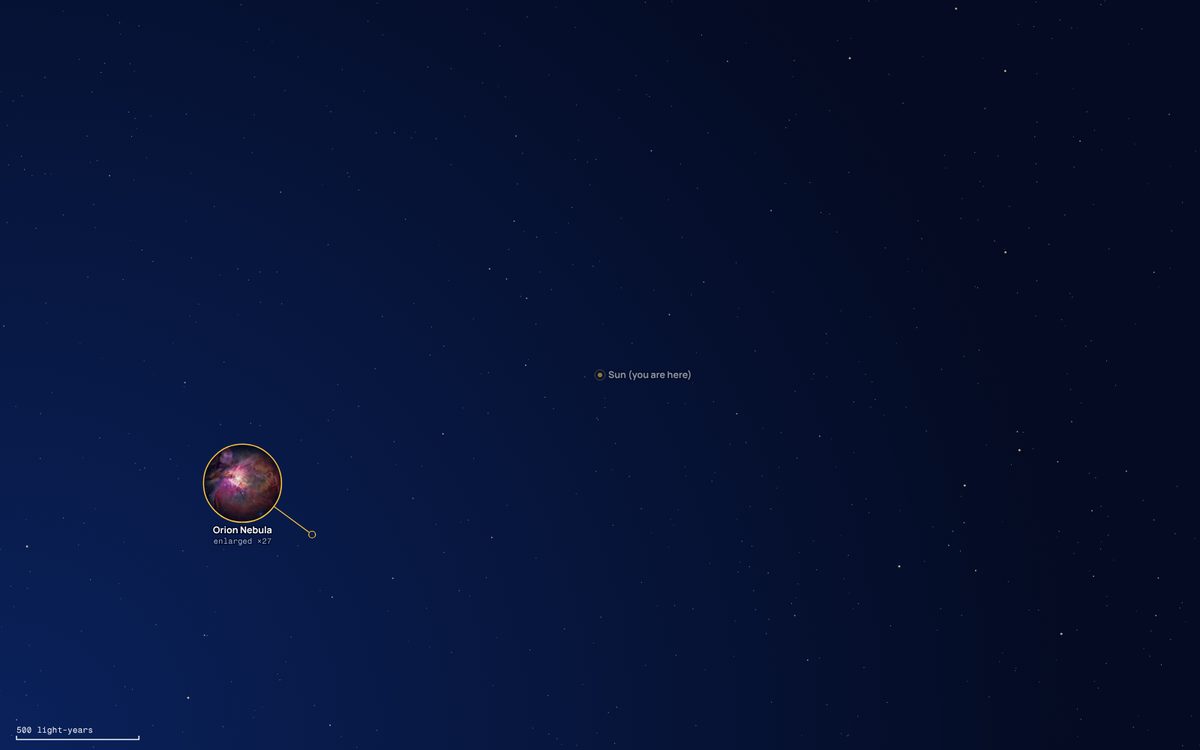
The nearest big star nursery is the Orion Nebula, about 1,350 light-years away and visible to the naked eye as the fuzzy middle "star" of Orion's sword. The Hubble mosaic in the simulation covers 30 arcminutes of sky, which at that distance is about 12 light-years across. In a view 3,000 light-years wide, that is a speck.
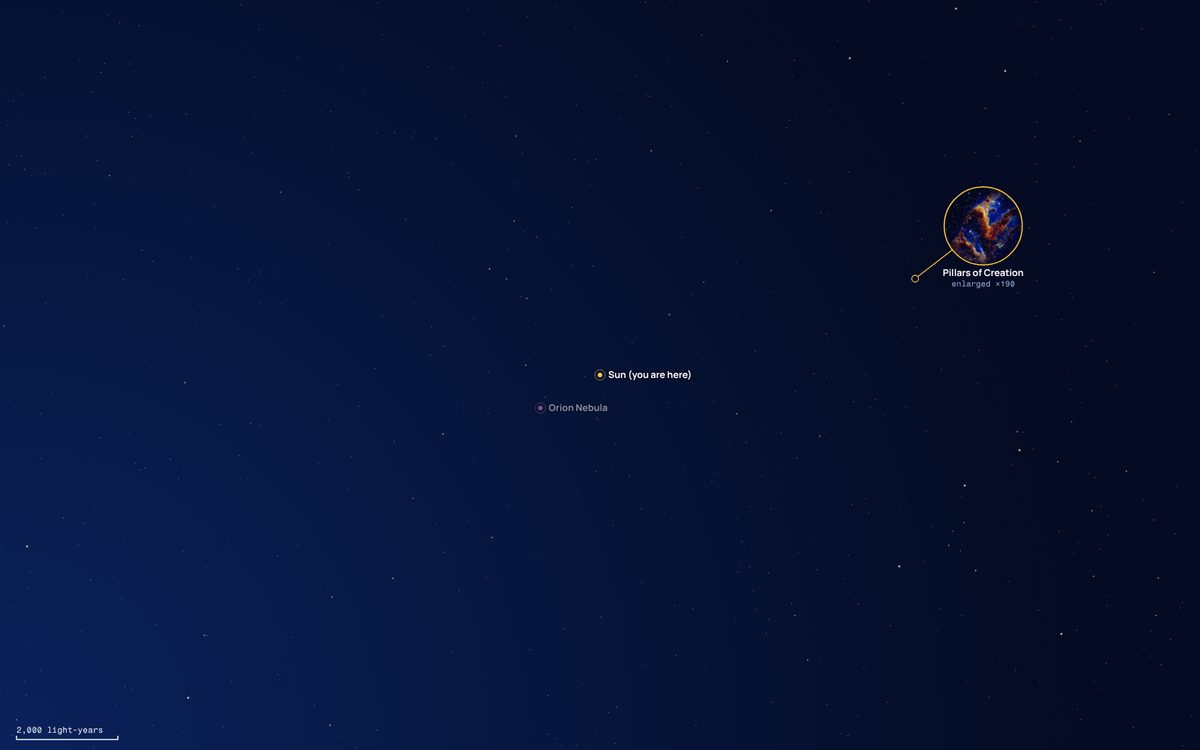
The Pillars of Creation are columns of cold gas and dust where new stars are forming. The tallest is roughly 4 light-years long. Webb's near-infrared camera sees through much of the dust, so young stars glow inside the columns; how a star's mass sets its future is covered in the star life cycle.
Stop 12: the Milky Way
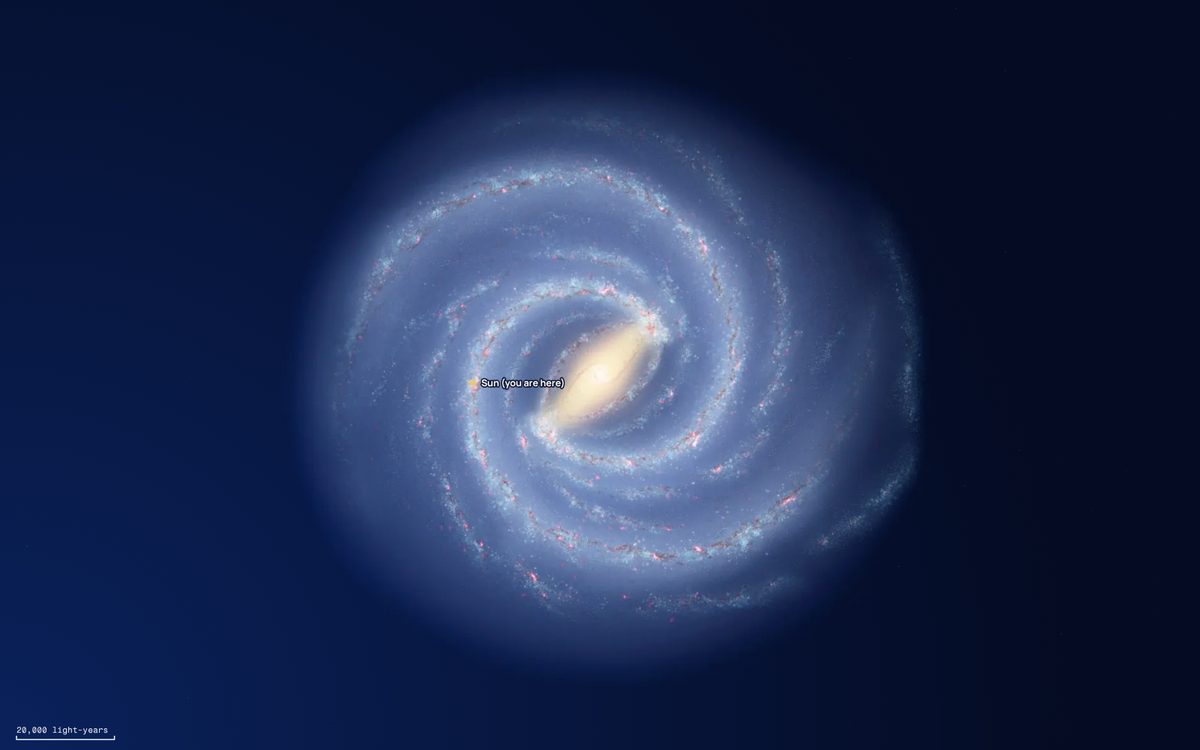
Everything so far, every star you have ever seen with your own eyes, fits inside one small patch of this picture. The Milky Way's disk is about 100,000 light-years across and holds 100 to 400 billion stars. The Sun orbits about 26,000 light-years from the centre, in a minor arm called the Orion Spur, taking about 230 million years per lap.
This is the one picture in the simulation that is not a photograph. We live inside the disk, so we can only map it from within, using star counts, radio maps of gas and infrared surveys. The NASA illustration used here was drawn from that data, and the simulation calibrates it so the Sun sits exactly 26,000 light-years from the centre.
Stops 13 and 14: the Magellanic Clouds, Andromeda and the Local Group
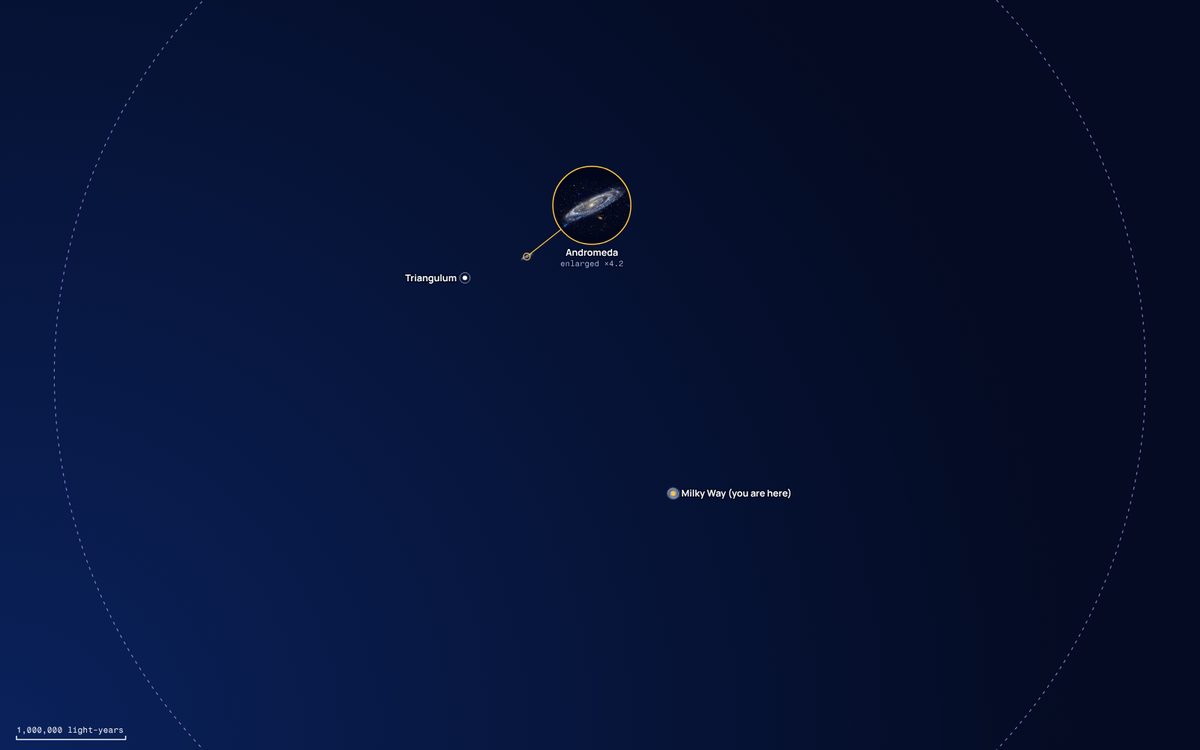
Two small galaxies orbit ours: the Large Magellanic Cloud, about 160,000 light-years away, and the Small Magellanic Cloud at about 200,000. Both are easy naked-eye sights from the Southern Hemisphere.
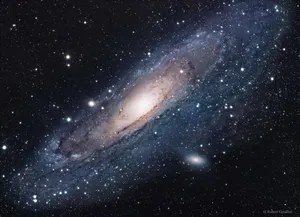
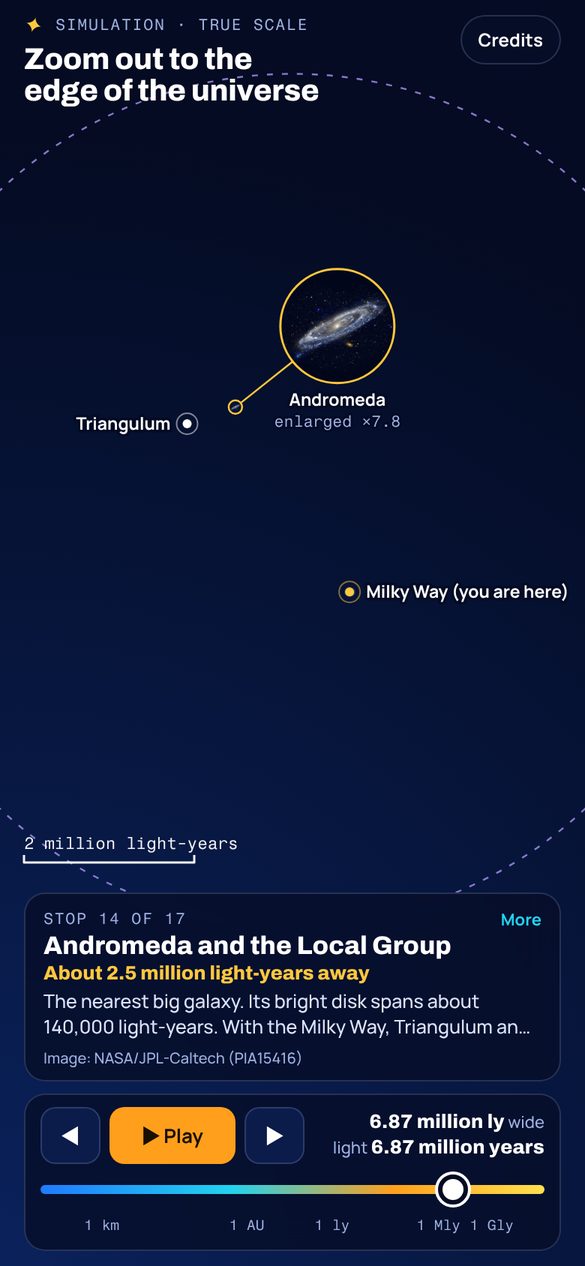
The nearest big galaxy, Andromeda, is about 2.5 million light-years away. Its bright disk spans about 140,000 light-years and faint stars reach further. The light reaching your eye from it tonight set off around the time early humans were making their first stone tools. Andromeda, the Milky Way, Triangulum and dozens of dwarf galaxies form the Local Group, about 10 million light-years across.
Notice the contrast with the stars. Stars are separated by 30 million times their own size, but Andromeda is only about 25 Milky Way widths away. Galaxies are crowded by comparison, which is why they collide: Andromeda is approaching at about 110 km/s. For how astronomers proved these "nebulae" were separate galaxies at all, read are there multiple galaxies in the universe.
Stops 15 and 16: the Virgo Cluster and Laniakea
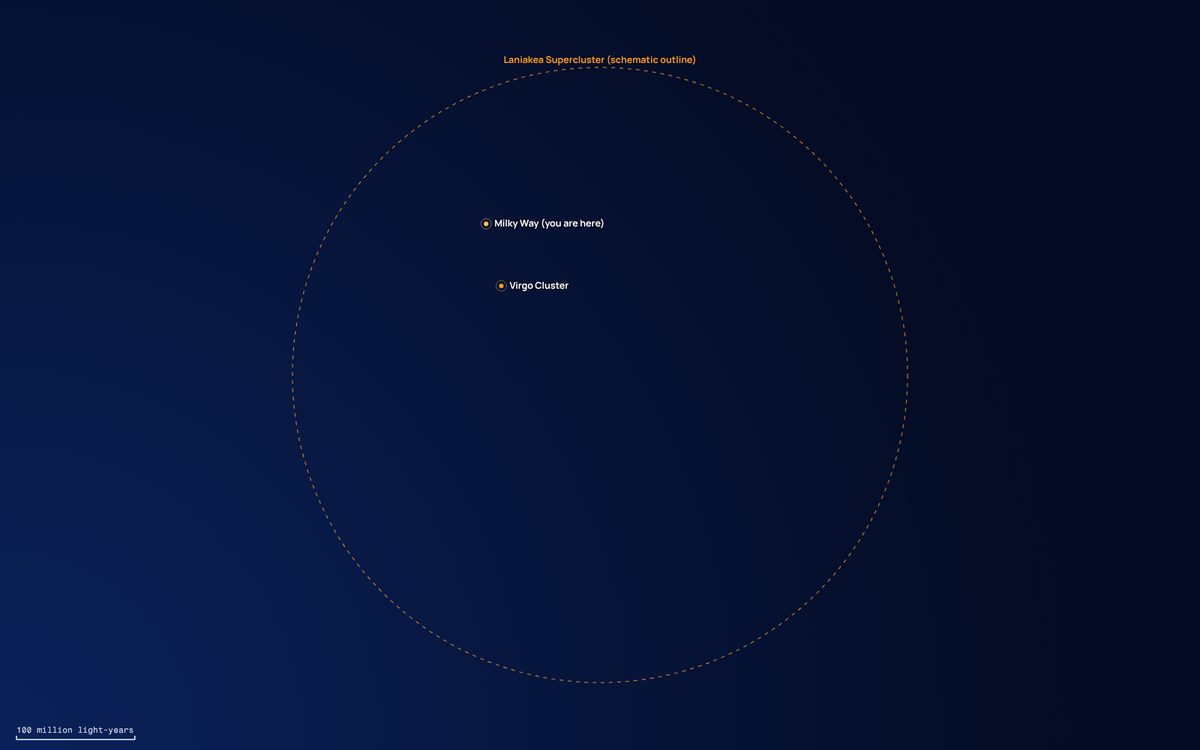
Zoom out past the Local Group and the whole of it collapses into a single dot. The Virgo Cluster, about 54 million light-years away, holds more than 1,300 galaxies, and its gravity tugs on ours. In 2014 a team led by Brent Tully mapped how thousands of galaxies move and found the basin we all flow within: the Laniakea Supercluster, about 520 million light-years across, with the mass of around 100,000 large galaxies. Galaxy motions show up as redshift and blueshift in their light, which we explain in reading starlight.
Stop 17: the observable universe
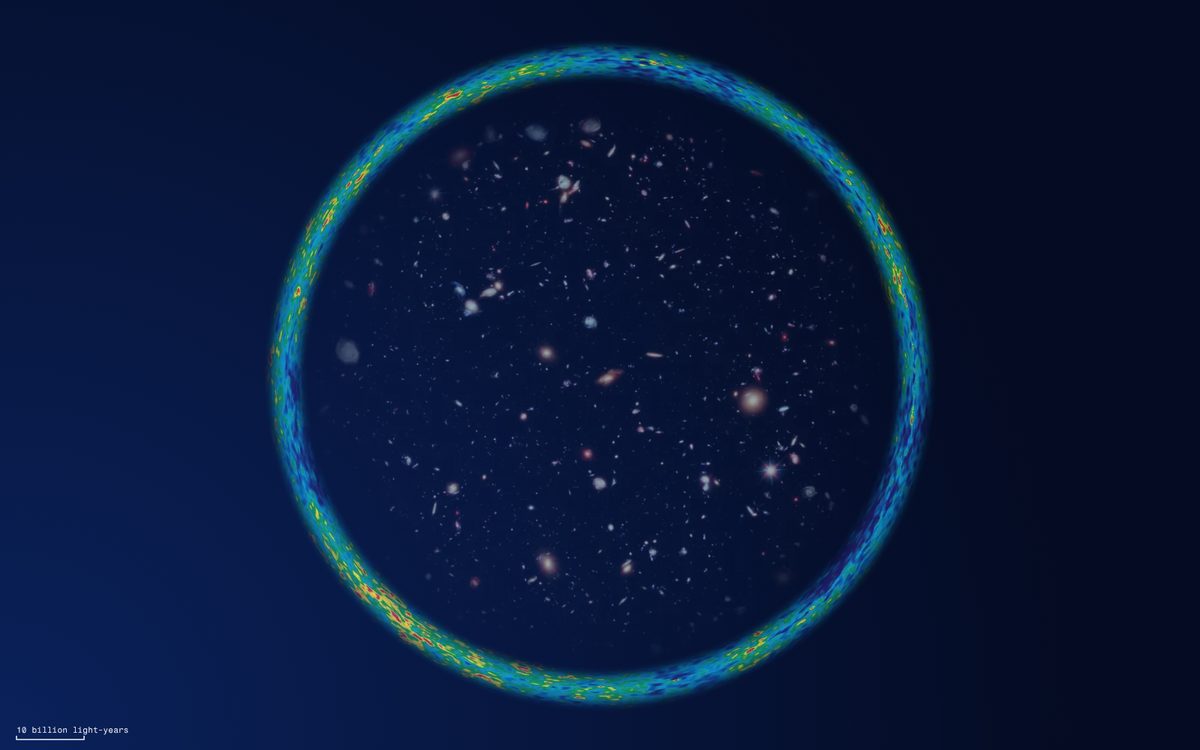
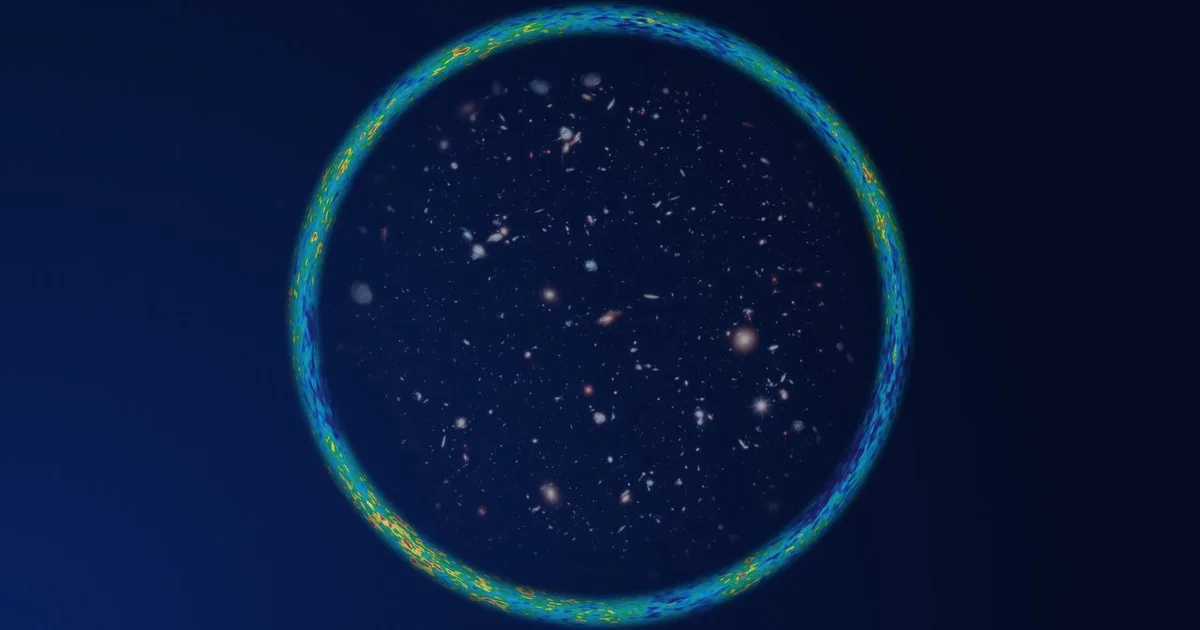
The last stop is the edge of what we can ever see. The ring is the cosmic microwave background, the oldest light in the universe, released about 380,000 years after the Big Bang when the universe first became transparent. In the simulation it is the real WMAP sky map, sampled along the plane of the Milky Way and wrapped around the edge, so each direction on screen shows the microwave sky in that direction. Inside it, the Hubble eXtreme Deep Field stands in for the hundreds of billions of galaxies (some estimates say up to two trillion) that the observable universe holds.
Why is it 93 billion light-years and not 27.6?
The universe is 13.8 billion years old, so you might expect a radius of 13.8 billion light-years. But space expanded while the light travelled. The matter that emitted the microwave background is now about 46 billion light-years away, even though its light has only been travelling for 13.8 billion years:
The radius comes from integrating the expansion history of a flat universe with today's measured matter and dark energy content (the Planck results), not from simple multiplication.
One more detail matters for the simulation. The light-crossing readout keeps dividing width by the speed of light, but beyond about a billion light-years that number ignores the expansion of space, so the simulation says so on screen. Light could not actually cross the observable universe in 93 billion years, because the space it would cross keeps growing.
The whole zoom in one table
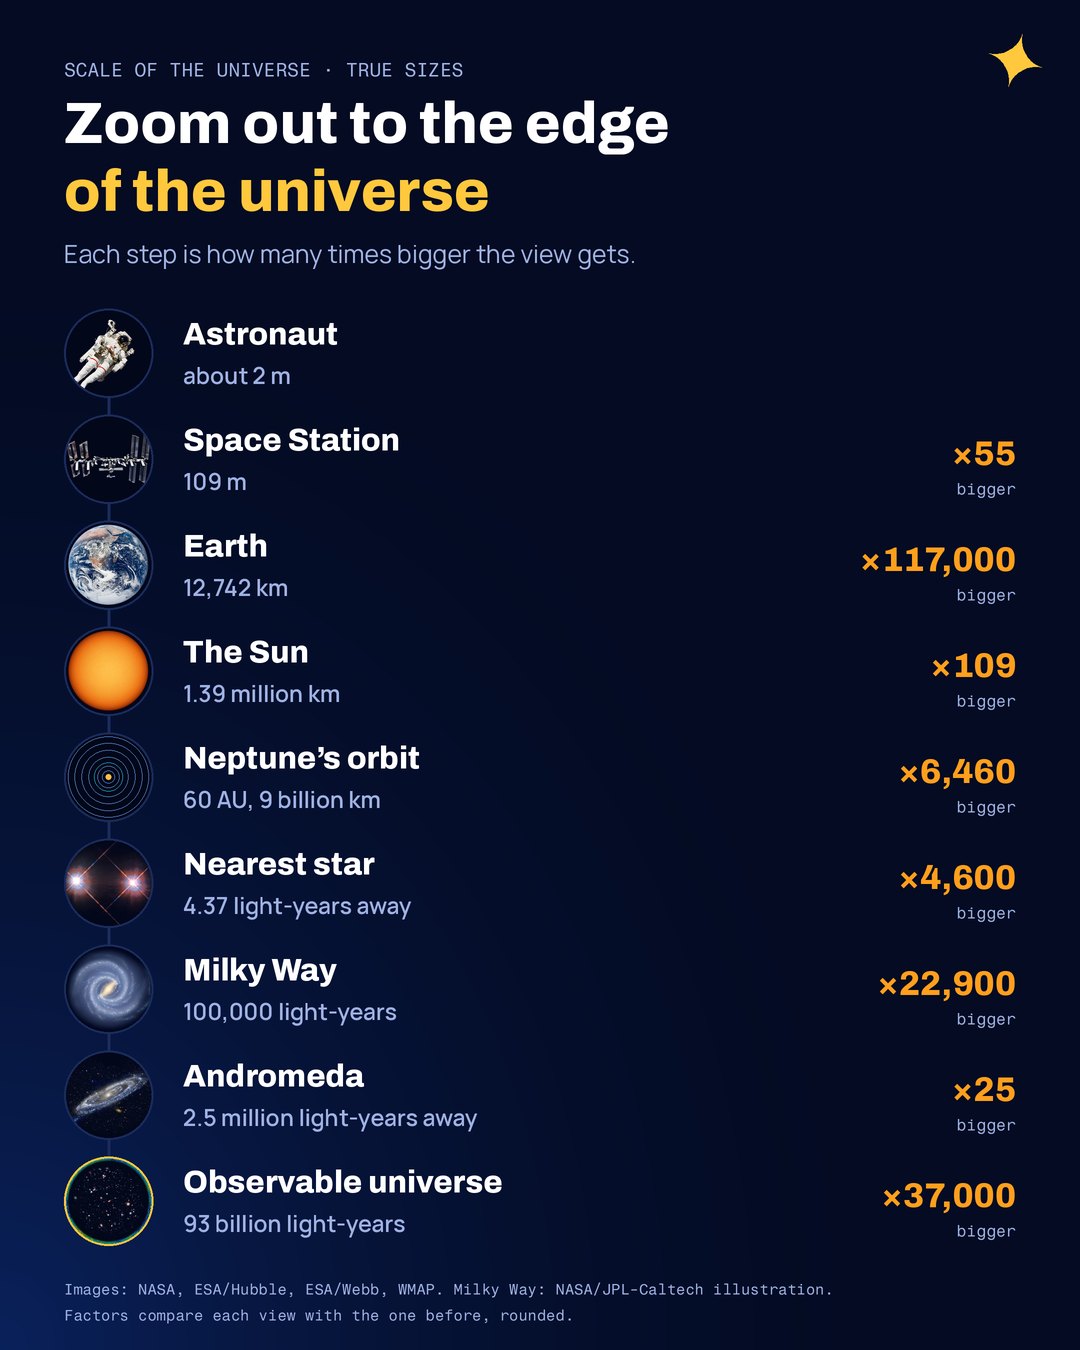
| Stop | Size or distance | Light crosses it in |
|---|---|---|
| Astronaut | about 2 m | 7 ns |
| International Space Station | 109 m | 0.36 µs |
| Earth | 12,742 km | 43 ms |
| Earth to Moon | 384,400 km | 1.3 s |
| The Sun | 1.39 million km | 4.6 s |
| Earth to Sun | 150 million km (1 AU) | 8 min 20 s |
| Neptune's orbit | 60 AU across | 8.3 hours |
| Voyager 1 | about 170 AU | about 1 day |
| Alpha Centauri | 4.37 light-years | 4.37 years |
| Orion Nebula | 1,350 light-years away | 1,350 years |
| Milky Way | 100,000 light-years | 100,000 years |
| Andromeda | 2.5 million light-years away | 2.5 million years |
| Virgo Cluster | 54 million light-years away | 54 million years |
| Laniakea | 520 million light-years | 520 million years |
| Observable universe | 93 billion light-years | no single answer (space expands) |
Use the universe zoom out on your phone
The simulation is built to stay light: the twelve images together weigh well under a megabyte, they load nearest first, and nothing is redrawn unless the view changes. It was laid out for phones first. The information card stays short and opens with a tap, the readout switches to compact units such as "ly", labels near the edge of the screen flip sides so they never run off it, and a full screen button gives the zoom the whole display when you open it inside this site. Turn a phone sideways and the card and controls sit side by side so the view keeps most of the screen.
On a computer you can scroll, use the arrow keys, or press Play and watch the whole tour in about a minute. Every stop also has its own link, such as stop 12, the Milky Way, so you can send a friend straight to the part that surprised you. If you prefer a tidy ruler from protons to the cosmos, our earlier scale of the universe simulation does that with drawn objects, and planet and star size comparison lines up worlds and giant stars side by side.
Frequently asked questions
How big is the observable universe?
About 93 billion light-years across, or about 8.8 × 1026 meters. That is roughly 46.5 billion light-years in every direction from Earth. It is the region from which light has had time to reach us in the 13.8 billion years since the Big Bang, stretched by the expansion of space while that light was travelling.
Why is the observable universe 93 billion light-years wide if it is only 13.8 billion years old?
Light that left the earliest matter 13.8 billion years ago has been travelling through expanding space. The matter that emitted it is now about 46 billion light-years away, because the space between us kept stretching after the light set off. Twice that radius gives the 93 billion light-year diameter.
How many times bigger is the universe than a human?
The observable universe is about 8.8 × 1026 m across and a person is about 1.7 m tall, so it is roughly 5 × 1026 times bigger: about 27 powers of ten. Starting from a 2 m astronaut in a spacesuit, the simulation zooms out by a factor of about 4 × 1026.
If the Sun were a marble, how far away would the nearest star be?
Shrink the Sun to a 1 cm marble and Earth becomes a grain 0.09 mm wide about 1.1 m away. Alpha Centauri, the nearest star system, would then be about 300 km away. Stars are separated by tens of millions of their own widths.
Are the images in the zoom-out simulation real?
Yes, all but one. The astronaut, the ISS, Earth, the Moon, the Sun, Alpha Centauri, the Orion Nebula, the Pillars of Creation, Andromeda, the Hubble eXtreme Deep Field and the microwave background map are real images from NASA, ESA/Hubble, ESA/Webb and WMAP. The Milky Way is a NASA illustration, because no camera has ever left our galaxy.
Related on The Science 360
Sources
- NASA, "Bruce McCandless II, first untethered spacewalk" (STS-41B, 1984), image S84-27017: images.nasa.gov
- NASA, International Space Station facts and figures: nasa.gov
- NASA Space Science Data Coordinated Archive, Earth, Moon and Sun fact sheets: nssdc.gsfc.nasa.gov
- NASA JPL, Voyager mission status and heliopause crossing: science.nasa.gov
- RECONS, the 100 nearest star systems (distances): recons.org
- K. M. Menten et al., "The distance to the Orion Nebula", Astronomy & Astrophysics 474, 515 (2007); ESA/Hubble image heic0601a: esahubble.org
- ESA/Webb, Pillars of Creation (NIRCam), weic2216a: esawebb.org
- GRAVITY Collaboration, "A geometric distance measurement to the Galactic center black hole with 0.3% uncertainty", A&A 625, L10 (2019)
- R. B. Tully, H. Courtois, Y. Hoffman and D. Pomarède, "The Laniakea supercluster of galaxies", Nature 513, 71 (2014)
- Planck Collaboration, "Planck 2018 results. VI. Cosmological parameters", A&A 641, A6 (2020)
- NASA/WMAP Science Team, nine-year ILC map, LAMBDA archive: lambda.gsfc.nasa.gov
- C. J. Conselice et al., "The evolution of galaxy number density at z < 8 and its implications", ApJ 830, 83 (2016)
All images in the simulation and in this article are real space images, cropped and resized, except the Milky Way (NASA/JPL-Caltech/R. Hurt illustration). Full credits: astronaut NASA; ISS NASA/Roscosmos; Earth and Moon NASA (Apollo 17); Sun NASA/GSFC/SDO, colour added; Alpha Centauri ESA/Hubble & NASA (CC BY 4.0); Orion Nebula NASA, ESA, M. Robberto (STScI/ESA) and the Hubble Space Telescope Orion Treasury Project Team (CC BY 4.0); Pillars of Creation NASA, ESA, CSA, STScI; J. DePasquale, A. Koekemoer, A. Pagan (STScI) (CC BY 4.0); Andromeda NASA/JPL-Caltech (GALEX); eXtreme Deep Field NASA, ESA, G. Illingworth, D. Magee, P. Oesch (UC Santa Cruz), R. Bouwens (Leiden Obs.) and the HUDF09 Team; microwave background NASA/WMAP Science Team. Header image: a snapshot of the simulation at its last stop, made from the WMAP nine-year microwave background map (NASA/WMAP Science Team) and the Hubble eXtreme Deep Field (NASA, ESA, G. Illingworth et al.).