How Does an MPPT Charge Controller Work? Real Curves

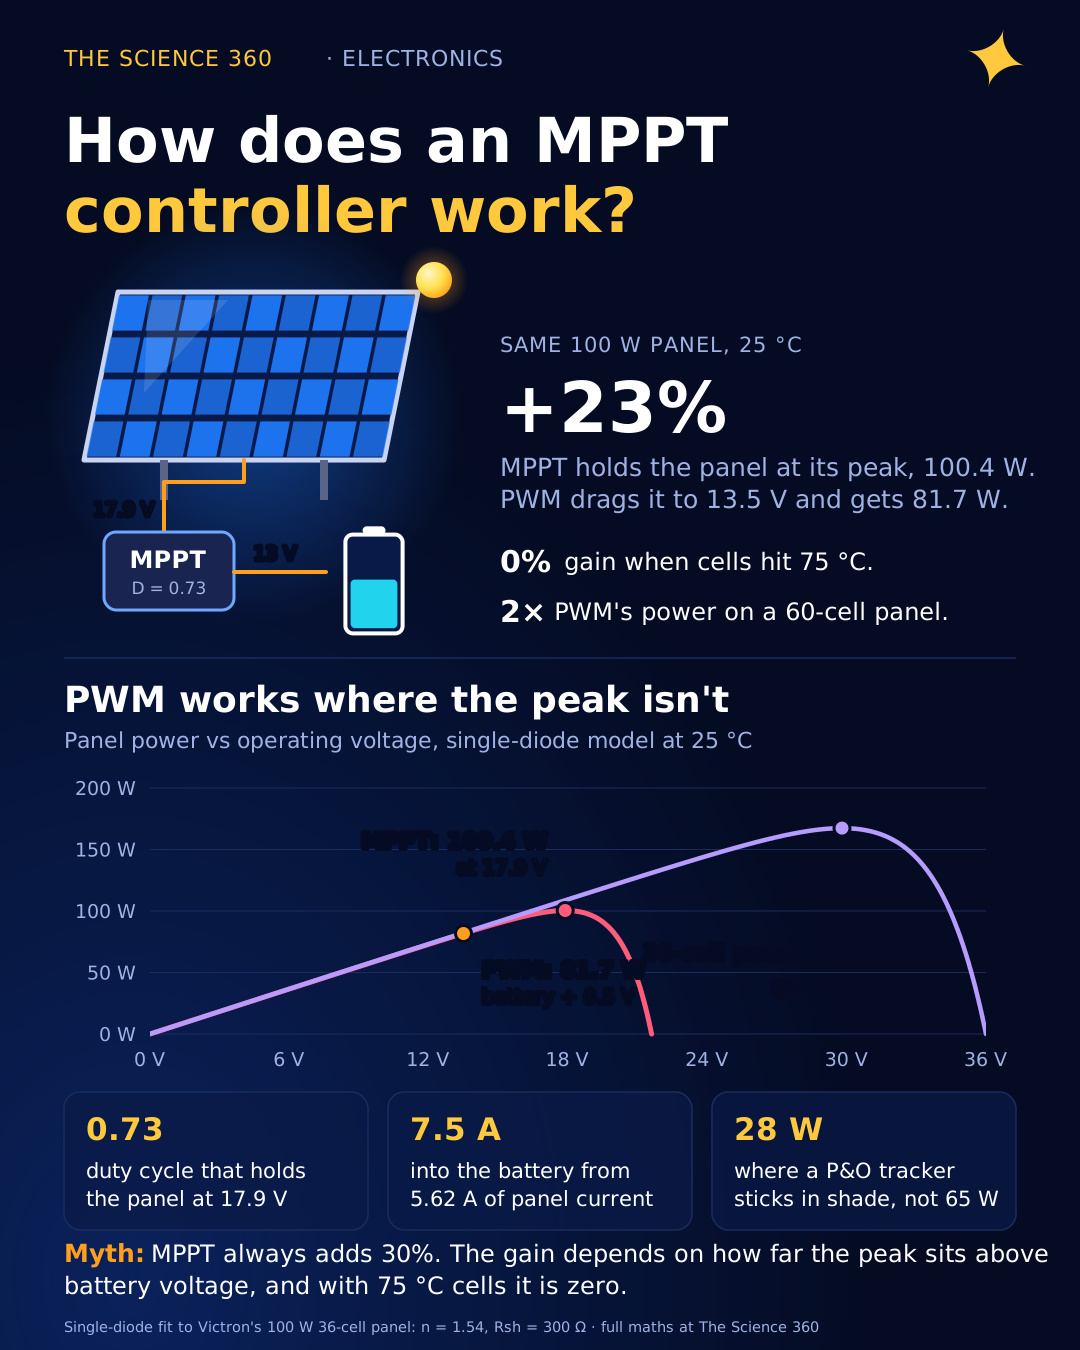
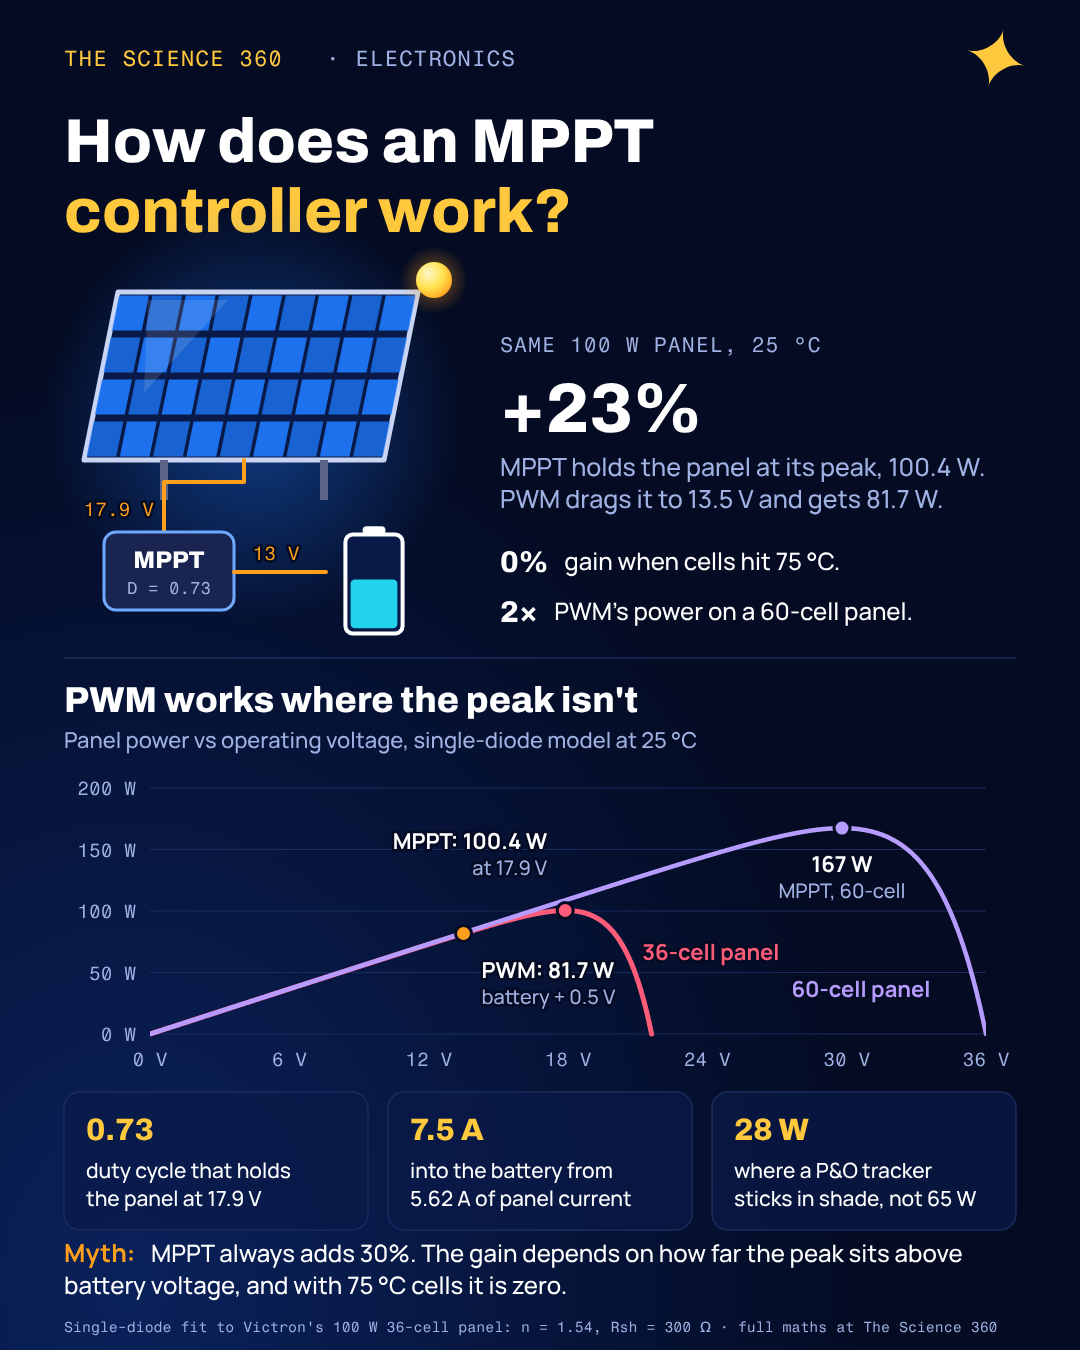
Clip a 100 W solar panel straight onto a half-charged 12 V battery through a simple PWM controller and, on a mild sunny day, you will harvest about 81 W. Victron Energy works through exactly this example in its own technical note. Swap in an MPPT controller and you get close to the full 100 W. Do the same experiment with the panel baking at 75 °C on a summer roof, and the two controllers give the same answer to within a watt.
Both results come from the shape of one curve. Once you can read it, you can see what an MPPT controller actually does, why its advertised "up to 30 percent more" is sometimes true and sometimes zero, and how a few lines of firmware hunt for the peak.
Why does a solar panel have a “maximum power point”?
A solar cell is a large silicon diode that light turns into a current source. The standard description is the single-diode model: a photocurrent IL proportional to sunlight, minus the current that leaks back through the diode, which grows exponentially with voltage.
= cells in series (36 here); at 25 °C; = ideality factor.
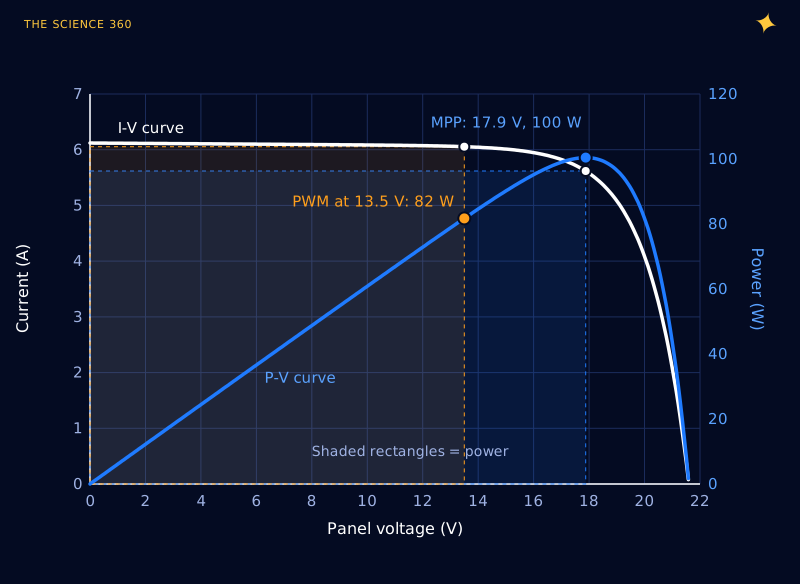
At low voltage the diode is off and the panel is a near-perfect current source: about 6 A whether you take it at 2 V or 12 V. As the voltage approaches about 18 V, the diode starts conducting and the current collapses, hitting zero at the open-circuit voltage. Power is , so it is zero at both ends (zero volts at short circuit, zero amps at open circuit) and peaks in between, right at the knee.
For the figures in this post I fitted that model to Victron's example panel: 100 W, 36 cells, Vmp = 18 V, Imp = 5.56 A, Voc = 21.6 V, Isc = 6.12 A. The best fit is n = 1.54 with 300 Ω of shunt resistance. As a check, the model reproduces Victron's numbers for both controllers at 25 °C and at 75 °C to within about a watt.
What does a PWM charge controller do wrong?
A PWM controller is a switch. When it is on, the panel is connected straight to the battery, so the panel's voltage is pulled down to the battery's voltage plus wiring and controller losses. Victron allows 0.5 V for those losses. When the battery is full, the switch pulses on and off to limit the charge, which is where the name comes from.
PWM, 13 V battery, 25 °C cells
The panel current comes from the curve. Victron's figure: 81 W.
MPPT at the same moment
About 23% more, before converter losses.
The PWM controller is not losing energy as heat in any dramatic way. It simply forces the panel to work at a voltage where it produces less power. The panel is a current source on that flat part of the curve, so the extra 4.4 V of potential is never collected at all.
How does an MPPT controller turn that voltage into charge current?
The MPPT controller decouples the panel from the battery with a switch-mode buck (step-down) converter. A buck converter's output voltage is set by its duty cycle , the fraction of each switching cycle that its main transistor is on: . Turn that around and you see the trick. With the battery holding the output at 13 V, choosing chooses the input voltage, which is the panel's operating voltage.
Duty cycle to hold the panel at its MPP
Battery current (power in = power out, minus losses)
Compare: PWM puts 6.05 A into the battery; panel current is only 5.62 A at the MPP.
So yes, an MPPT controller "increases the current", but only in the way any step-down converter does. Victron's SmartSolar datasheets quote a maximum conversion efficiency of 98 percent, and typical efficiency at partial load is a little lower, which is why I use 97 percent throughout.
The misconception: “MPPT always gives you 30% more”
Marketing pages and most top search results quote a gain of 20 to 30 percent, sometimes more, as though it were a property of the controller. It is not. The gain depends entirely on how far the panel's MPP voltage sits above the battery voltage, and that distance moves with temperature.
Silicon cells lose voltage as they heat up. Victron's panel loses 0.47 percent of Vmp per °C, while its current barely changes. On a hot roof, cells easily reach 75 °C, 50 °C above the 25 °C rating condition:
Shift of the MPP at 75 °C
Those are Victron's figures; the model gives 14.1 V and 78.4 W. PWM at 13.5 V gets 77.8 W in the model, 77 W by Victron's reading of the curve.
After 97% conversion, MPPT gives no gain at all.
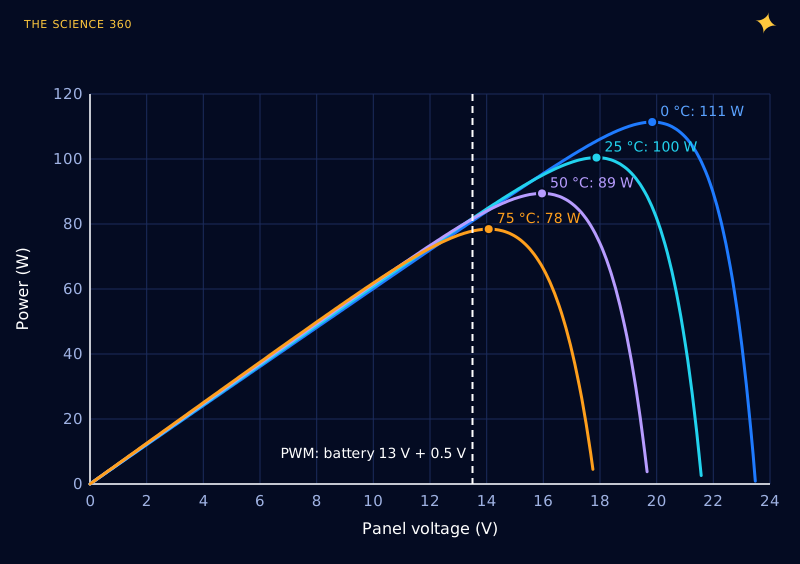
Run the comparison over the full range of temperatures and battery voltages and you get Figure 3. This is the chart I wish every "MPPT vs PWM" article included.
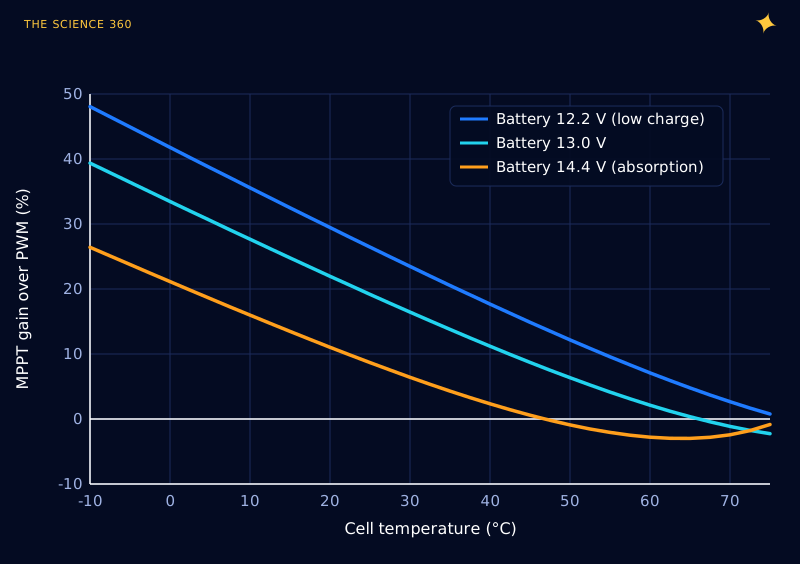
This is the reason behind Victron's conclusion that MPPT outperforms PWM in cold to temperate climates, while the two perform about the same in subtropical and tropical ones. Cell temperature is typically 20 to 30 °C above the air on a sunny day, so "75 °C cells" is a normal summer afternoon in a hot climate, not an extreme.
Where MPPT really pays: high-voltage panels
The 36-cell panel is the one case designed to suit PWM, because its Vmp of about 18 V was chosen decades ago to charge 12 V batteries directly. Modern residential panels have 60 or 72 cells (or the half-cut equivalents) and an MPP of 30 to 40 V. Put one of those on a 12 V battery through PWM and the panel is dragged all the way down its flat current region.
A 60-cell panel on a 12 V battery (same cells, scaled model)
At 13.5 V the PWM current is almost exactly = 6.09 A. MPPT gives about 2 times PWM.
That near doubling is where MPPT earns its price. It also lets you wire panels in series at 40 to 100 V or more and run thinner, cheaper cable from the roof, since power lost in the wire scales with current squared. A PWM controller cannot do that at all.
How does the tracking algorithm find the peak?
The controller does not know the curve. It only knows what it can measure: panel voltage and current, each cycle. The classic method, still common in low-cost controllers, is called perturb and observe (P&O):
- Nudge the operating voltage a small step (by changing the duty cycle).
- Measure the new power, V × I.
- If power went up, keep stepping in the same direction. If it went down, reverse.
That is the entire algorithm. It is a hill climb on the P-V curve, and Figure 4 shows it running on our model panel with 0.3 V steps.
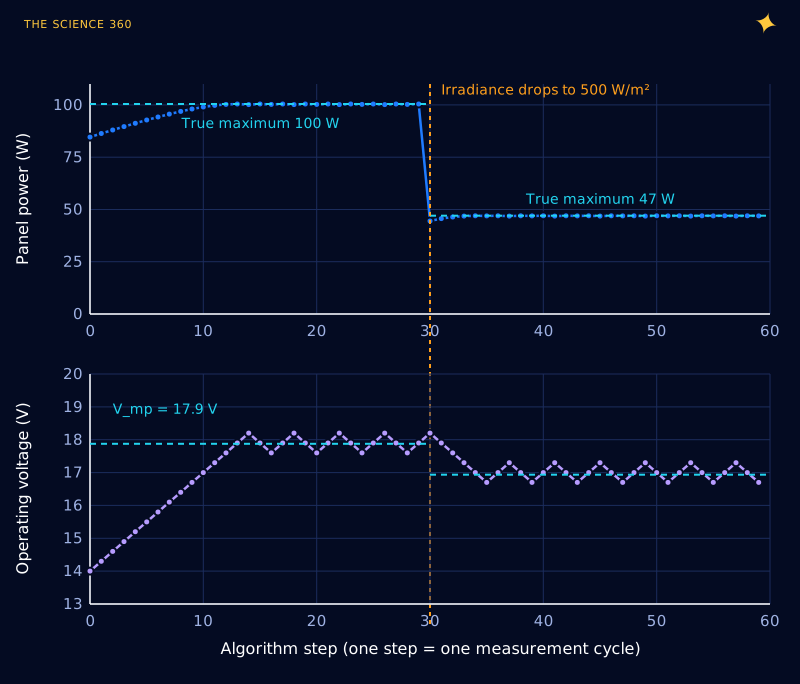
Two properties are visible. First, P&O never sits still: it permanently oscillates by a step or two around the MPP. Near the top of the curve that costs very little, because the power curve is flat there: in the model, running 0.3 V off the peak costs about 0.1 W out of 100. Second, step size is a trade-off between speed and dither. A bigger step tracks a passing cloud faster but wobbles further from the peak.
The cost of dithering, from the curve
Average over a 3-level dither ≈ 100.3 W, a loss of about 0.1%.
A more refined method, incremental conductance, uses calculus instead of trial and error. At the peak , and since , that means , or . The controller compares the measured slope of the I-V curve with and knows which side of the peak it is on without needing to overshoot. In practice both methods land within a fraction of a percent of the peak on a clean curve. Esram and Chapman's widely cited 2007 survey compares these and many other methods.
What happens to MPPT under partial shading?
Here the hill-climbing story breaks. A panel's cells are wired in series in groups, usually three substrings of 12 cells for a 36-cell panel, each with a bypass diode. If one substring is shaded, it can no longer carry the full current, and above its reduced current the bypass diode switches on and routes the current around it. The result is a P-V curve with two humps.
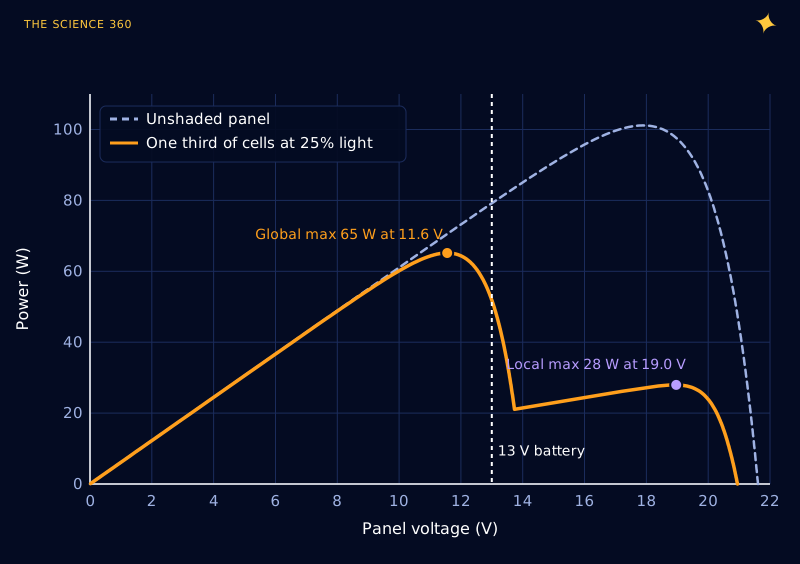
Two lessons hide in that figure. First, a simple P&O tracker starting near 17 or 18 V climbs the nearest hill and settles on the local maximum at 28 W, less than half of what is available, and Wikipedia's summary of the literature notes exactly this failure. Better controllers periodically sweep the whole voltage range to find the global peak. Second, and this one is rarely mentioned: the global peak here sits at 11.6 V, below the 13 V battery. A buck converter can only step voltage down, so it physically cannot hold the panel there. In this particular case a dumb PWM controller (at 13.5 V, 34 W in the model) actually beats a buck MPPT stuck on the right-hand hump (0.97 × 28 = 27 W). The real fix is series-wiring enough panels that even a shaded string sits well above battery voltage.
What else does an MPPT controller do?
Tracking is only half its job. Once the battery approaches full, maximising panel power would overcharge it, so the controller deliberately moves the panel off its MPP, toward open circuit, to deliver only the current the battery can accept. It runs the usual charge stages: bulk (maximum power), absorption (constant voltage, current tapering, the same physics as a phone's last 20 percent), and float. In absorption on a sunny day an MPPT controller is throwing away panel power on purpose, which is one more reason a brochure's "30 percent more energy" never shows up as 30 percent more in a daily total.
FAQ
Is MPPT worth it over PWM?
Yes when the panel voltage is well above the battery voltage, as with 60-cell or 72-cell panels or panels wired in series, and in cool climates. With a single 36-cell panel on a 12 V battery in hot weather the gain shrinks to almost nothing, and a cheaper PWM controller performs about the same.
How much more power does MPPT give?
For a 36-cell panel charging a 12 V battery, about 20 percent at a cell temperature of 25 °C, 30 to 40 percent on a cold sunny day, and roughly zero when the cells are at 70 to 75 °C. For a 60-cell panel on a 12 V battery, MPPT can deliver about twice what PWM does.
Does an MPPT controller increase current?
It increases battery current compared with panel current, because it is a step-down DC-DC converter: power in roughly equals power out, so when voltage goes down current goes up. A 100 W panel at 18 V and 5.6 A can charge a 13 V battery at about 7.5 A after converter losses.
Can an MPPT controller handle partial shading?
Partly. Shading with bypass diodes gives the power curve several peaks, and a simple perturb and observe tracker can settle on a local peak instead of the global one. Better controllers periodically sweep the whole voltage range to find the true maximum.
Related on The Science 360
Sources
- Victron Energy, "Which solar charge controller: PWM or MPPT?" technical information, 20 January 2020 (100 W 36-cell panel specification and temperature coefficients; PWM 81 W versus MPPT 100 W at 25 °C; 77 W versus 77.5 W at 75 °C; climate conclusion). Version consulted: victronenergy.de technical information PDF
- Victron Energy, SmartSolar charge controller MPPT 100/30 and 100/50 datasheet (maximum efficiency 98%): datasheet PDF (Swedish edition)
- Wikipedia, "Maximum power point tracking" (perturb and observe oscillation, incremental conductance condition, multiple peaks under partial shading): en.wikipedia.org/wiki/Maximum_power_point_tracking
- T. Esram and P. L. Chapman, "Comparison of Photovoltaic Array Maximum Power Point Tracking Techniques", IEEE Transactions on Energy Conversion 22(2), 2007: doi.org/10.1109/TEC.2006.874230
- PVEducation, "Solar cell I-V curve" and single-diode model background: pveducation.org/pvcdrom/solar-cell-operation/iv-curve
- Battle Born Batteries, "What is an MPPT charge controller?" (representative of current top results): battlebornbatteries.com/blogs/articles/mppt-charge-controller
Method note: all curves come from a single-diode model fitted to Victron's published 100 W panel specification (n = 1.54, Rsh = 300 Ω, series resistance fitted at zero), with temperature handled through the published Voc and Isc coefficients. The shading curve treats each 12-cell substring as a scaled copy of the panel with an ideal 0.4 V bypass diode. Converter efficiency is assumed to be 97%.
Header image: NASA (image iss024e007103), regraded for this article.