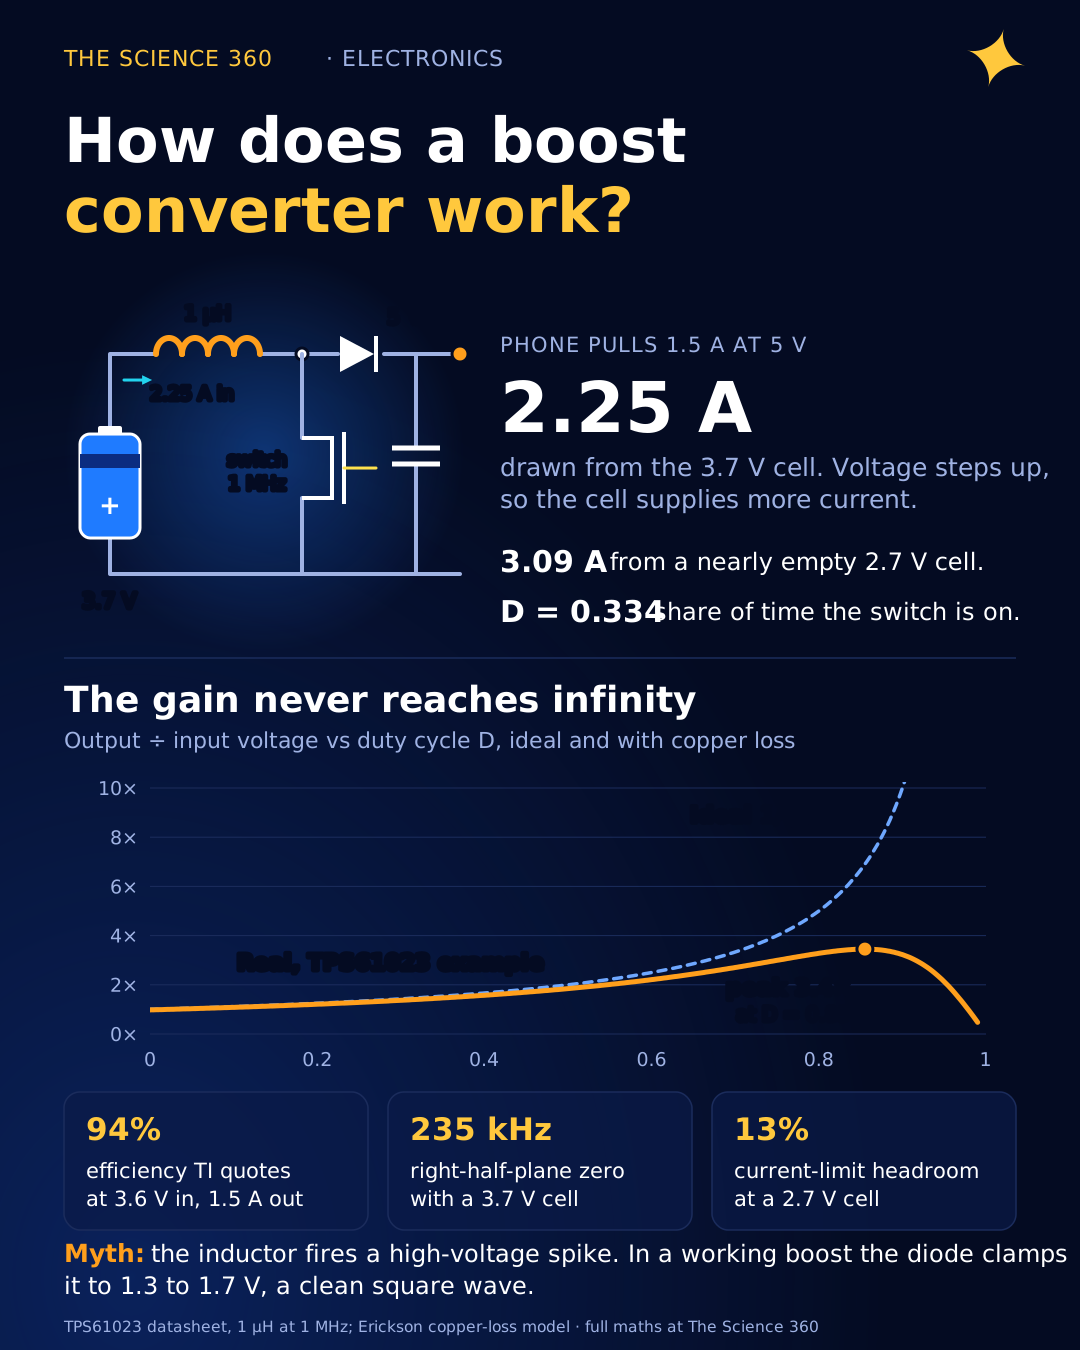
How Does a Boost Converter Work? Worked 3.7 V to 5 V

Open a cheap USB power bank and you will find one lithium cell, nominally 3.7 V, feeding a USB port that has to sit at 5 V. Between them sit a tiny chip, an inductor and a few ceramic capacitors. When your phone pulls 1.5 A from that port, the cell is delivering about 2.25 A, and when the cell sags toward empty it is delivering more than 3 A. The trick is that an inductor refuses to let its current change suddenly, and a switch exploits that a million times a second.
Most explanations end with and add that as D approaches 1 the output "goes to infinity", limited only by vague "losses". In a real converter the gain curve turns over: past a certain duty cycle the output voltage falls. Below we build the converter from the inductor up, work a real 3.7 V to 5 V design from a TI datasheet, and show exactly where the infinite-gain picture breaks.
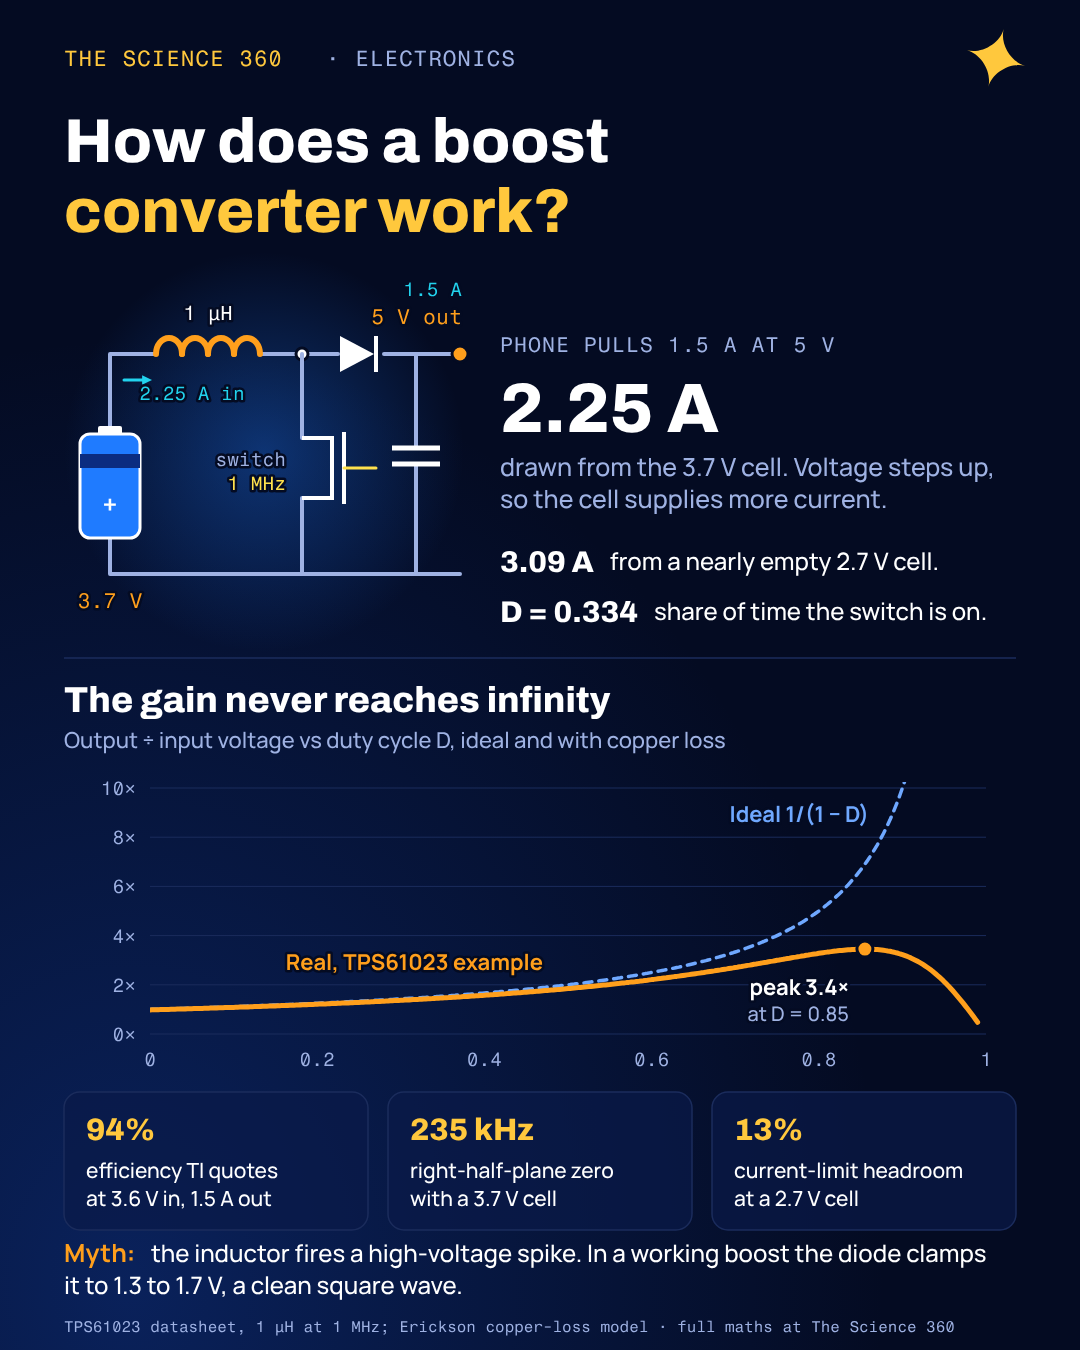
The circuit: one inductor, one switch, one diode, one capacitor
The boost is the buck converter's parts rearranged: the inductor runs from the battery to a switching node (SW), a low-side MOSFET goes from SW to ground, and a diode (or a second MOSFET) goes from SW to the output capacitor. As in how a buck converter works, two rules carry everything: in steady state the average inductor voltage is zero, and so is the average capacitor current.
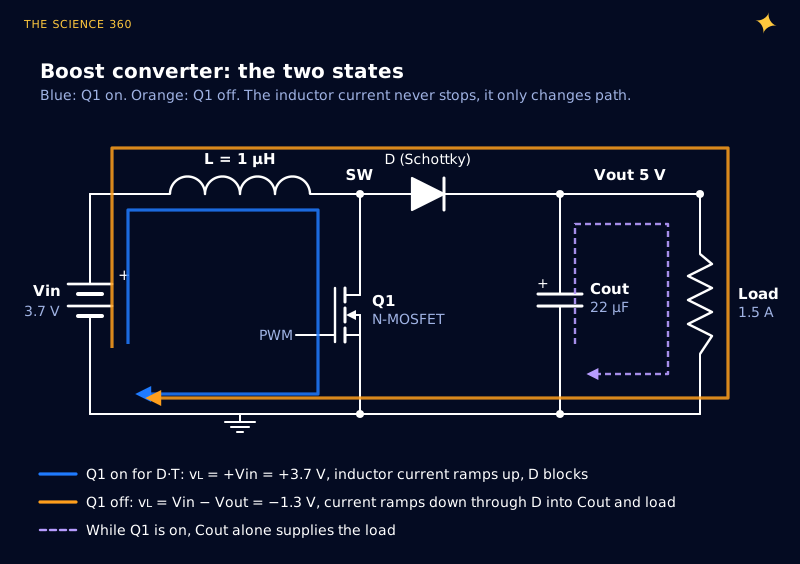
Switch on (time D·T). The full battery voltage sits across the inductor, so its current rises at : 3.7 A per microsecond for 3.7 V across 1 µH. The diode is reverse biased, and the capacitor alone feeds the load.
Switch off (time (1 − D)·T). The inductor current cannot stop instantly, so SW rises until the diode conducts, a fraction of a volt above Vout. The inductor now sees and its current ramps down slowly while it feeds the output.
Is the boost converter’s “inductor kick” a high-voltage spike?
Hobby explanations often describe the off phase as the inductor's "back EMF" producing a voltage spike that the diode collects. In a working boost there is no spike. The diode and output capacitor clamp the inductor voltage to Vout − Vin plus a diode drop, here 1.3 to 1.7 V, and the switch node is a clean square wave between 0 V and Vout (Figure 2). The inductor behaves like a current source topping up a reservoir.
The spike story is what happens when the clamp is missing. Disconnect the output, or let a diode fail open, and the energy in the inductor has to go into whatever capacitance sits on the switch node.
Energy in the inductor at the 2.87 A peak (worked example below):
Dumped into an assumed 500 pF of switch-node capacitance (our round number):
On a switch rated for about 6 V, that means avalanche or a dead chip. It is the same physics that makes a relay coil need a flyback diode; in a boost, the diode is the path the energy is meant to take.
Volt-second balance: where Vout = Vin/(1 − D) comes from
In steady state the current rise during the on time equals the fall during the off time. Since , volts multiplied by time must cancel:
Balance:
3.7 V to 5 V:
The diode conducts only during the off time, so charge balance on the capacitor gives the currents:
Check power:
A boost converter is a DC transformer: voltage up, current down, and every milliohm on the input side (cell, connector, winding, low-side switch) carries the larger current.
TI's design note SLVA372 adds one correction: the converter must also supply its own losses, so , with η an efficiency estimate (TI suggests 80% as conservative; the TPS61023 datasheet uses 90%).
Worked design: 3.7 V to 5 V at 1.5 A with the TPS61023
TI's TPS61023 synchronous boost has exactly this as its typical application: one lithium cell (2.7 to 4.35 V) to 5 V at 1.5 A. Key datasheet numbers: 1 MHz switching, a valley current limit of 3.7 A typical and 2.7 A minimum, 47 mΩ low-side and 68 mΩ high-side MOSFETs, and recommended 1 µH inductors such as the Coilcraft XEL4030-102ME (9.78 mΩ DCR, 9 A saturation).
Step 1: duty cycle (TI form, η = 0.9)
Step 2: average inductor current = battery current
Step 3: ripple
Step 4: peak and valley
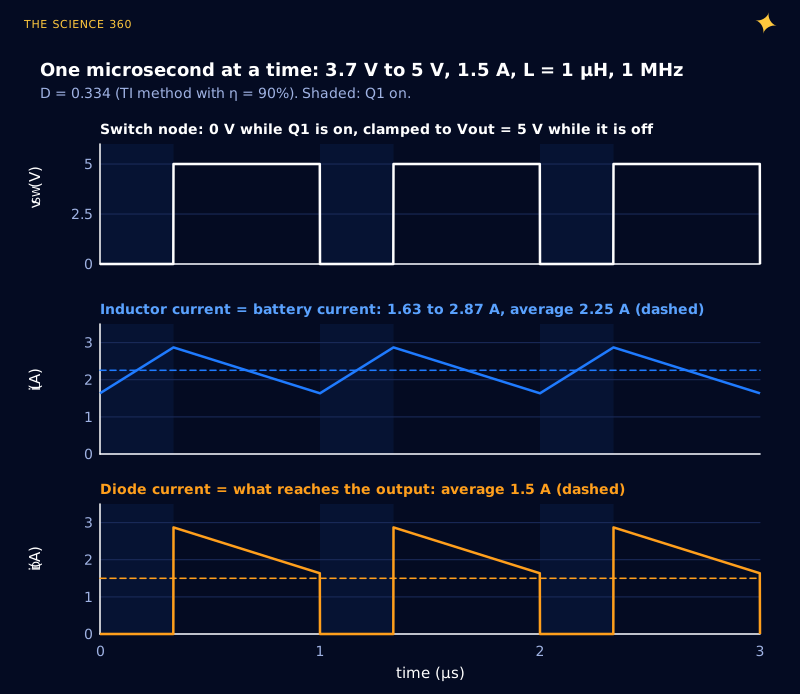
The ripple is 55% of the average, above the datasheet's advisable 40%, a trade its own 1 µH choice makes for size. The design must also work at the bottom of the battery's range:
At Vin = 2.7 V:
That is 3.09 A from the battery, with a peak of 3.78 A and a valley of 2.39 A. With the inductor 30% low (0.7 µH, the datasheet's suggested margin), ΔIL = 1.98 A, so the peak is 4.08 A and the valley 2.10 A.
The TPS61023 limits the valley of the inductor current. At full load and minimum battery the valley is 2.39 A against a guaranteed 2.7 A, about 13% headroom: the real constraint on this design, and invisible if you only compute the 3.7 V case.
Step 5: output capacitor (datasheet equation, ±50 mV ripple = 0.1 V peak to peak)
The datasheet warns that a ceramic capacitor "can lose more than 50% of its capacitance at its rated voltage", so a 10 µF, 6.3 V part at 5 V may deliver well under 7.7 µF; two 22 µF parts is a sensible build. The output current arrives in the chopped pulses of Figure 2, so low-ESR ceramics placed tight to the chip matter more than in a buck (see also why 100 nF is the standard decoupling capacitor).
Step 6: where the losses go. Here is our own rough conduction-loss budget at 3.7 V, using datasheet resistances:
The three losses are the inductor DCR, the low-side FET and the high-side FET. The total conduction loss is about 4.9% of the 7.5 W output.
TI quotes 94% at 3.6 V in and 5 V, 1.5 A out, about 0.48 W of total loss, which leaves roughly 0.1 W for switching and core loss. The high-side switch dominates, yet a 0.4 V Schottky in its place would burn by itself.
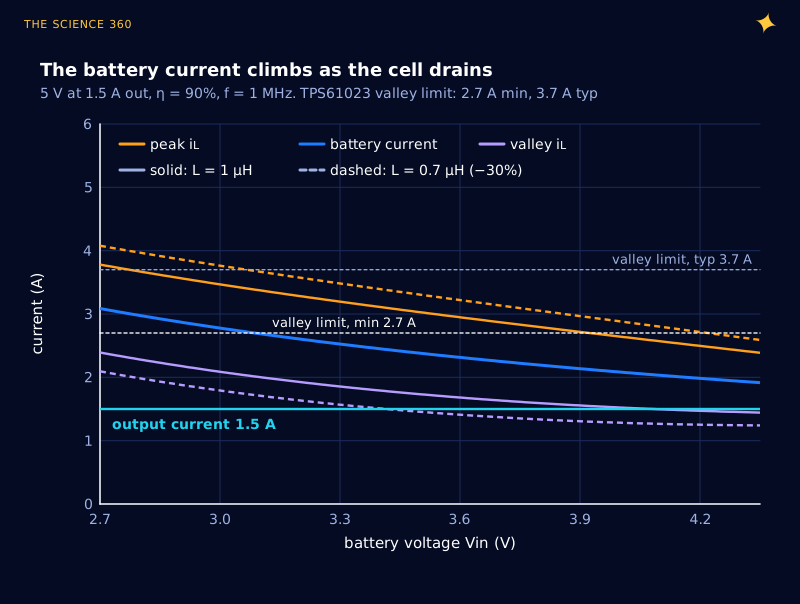
A cell with 100 mΩ of internal resistance loses 0.31 V at 3.1 A, which raises the current further; that is why boost-powered gadgets fall off a cliff near empty. For sizing the cell, see the LiPo C rating and battery life calculations.
Why doesn’t D → 1 give infinite voltage?
The ideal formula says D = 0.9 gives 10 times the input and 0.99 gives 100 times. Real converters do not get close, for a reason you can calculate.
Put a resistance RL in series with the inductor for winding and switch resistance. Erickson and Maksimović's Fundamentals of Power Electronics writes the same balance equations with it included, and . Solving:
Setting the derivative to zero (our algebra):
Worked example: R = 5 V / 1.5 A = 3.33 Ω, RL ≈ 0.07 Ω lumped (DCR plus FETs), so RL/R = 0.021:
The inductor current is , so copper loss grows as , and eventually each extra percent of duty cycle burns more than it delivers. At the gain peak, efficiency is exactly 50% (lower half of Figure 4).
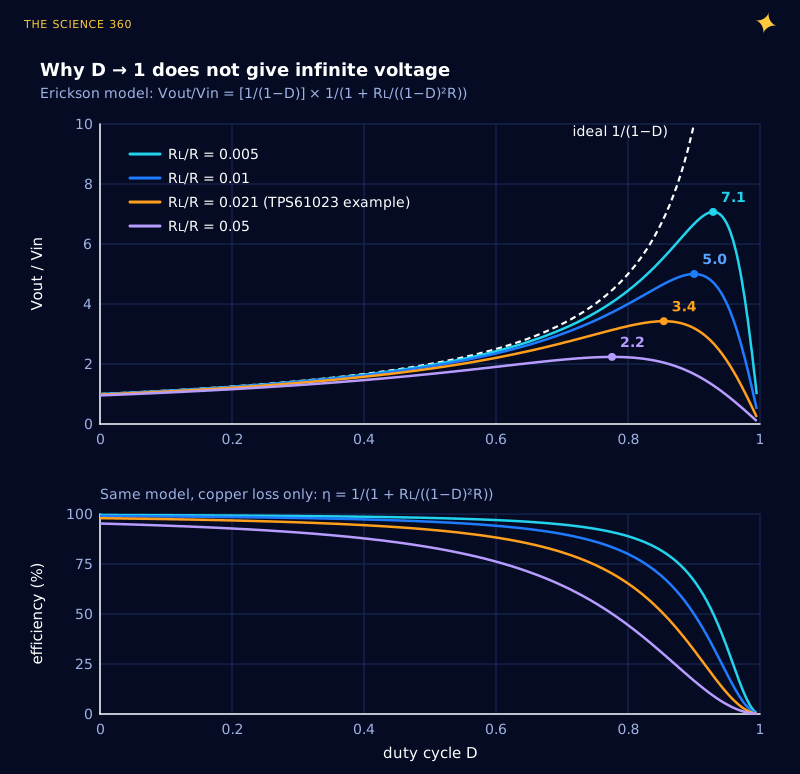
The turnover is nasty for feedback. Past the peak the loop sees the output low, increases D, the output falls further, and the controller drives itself to maximum duty with a collapsed output and a hot inductor. That is one reason controllers have a duty-cycle clamp and a current limit.
Copper is the first wall. The second is time: the TPS61023's minimum off time is 120 ns maximum, which at a 1 µs period caps D at 0.88 and the ideal gain at 8.3. The third is voltage: a 3.7 V to 370 V boost needs a switch rated above 370 V that charges its own capacitance to 370 V and dumps it every cycle.
Our illustrative numbers for a 100× boost: switch capacitance 50 pF, 370 V, 100 kHz.
At 10 mA out (3.7 W), that is 9% lost before any conduction loss.
So high ratios use two cascaded boosts (gains multiply), a coupled inductor or flyback transformer, or a capacitor multiplier after the boost.
The right-half-plane zero: why boost loops are slow
To raise the output, the controller increases D. But a longer on time means longer with the inductor disconnected from the output, so for the next few cycles the output gets less energy. TI's SLVA633 puts it plainly: "the output initially drops, even though the control command is trying to make it increase."
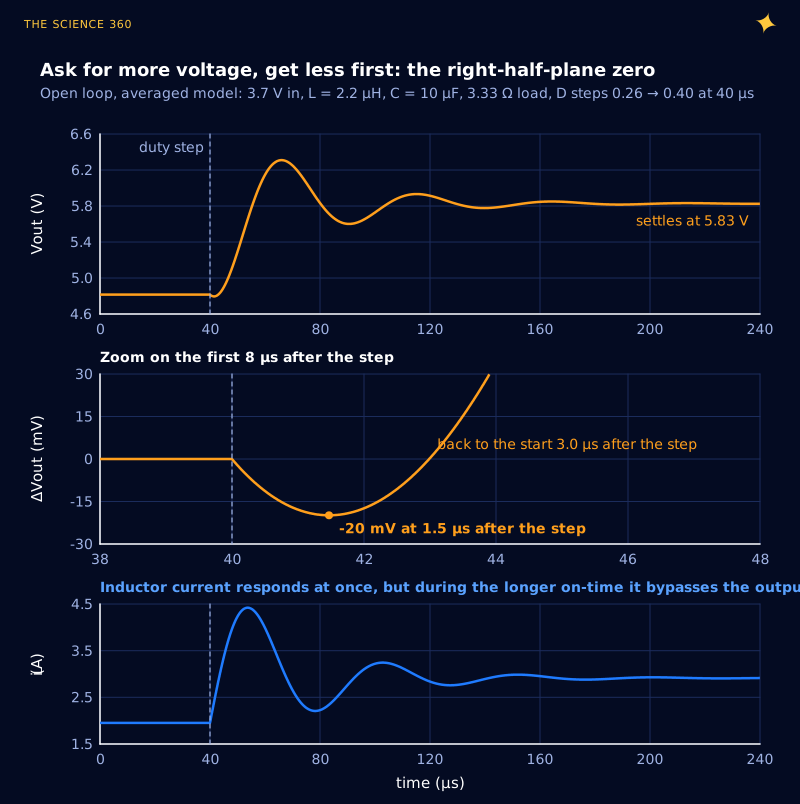
A response that starts the wrong way is the signature of a right-half-plane zero. From SLVA633 and SLVA274:
At 2.7 V, D = 0.514.
Heavier load, lower input voltage and a larger inductor all pull it down, the opposite of a buck, where a bigger inductor is simply calmer. SLVA633 says loop bandwidth "must be limited to considerably less than the frequency of the RHP zero". A common choice is a fifth or less, about 25 kHz here at low battery, so boost rails recover from load steps more slowly than a buck at the same switching frequency.
Why can’t you switch a boost converter off?
With Q1 off forever, the battery still reaches the output through the inductor and diode, so the load sees about Vin minus a diode drop. Chips like the TPS61023 list load disconnect as a feature for this reason, and enter a pass-through mode when the input rises above the set output. The same inductor-and-duty-cycle logic, with a smarter controller, sits inside solar charge controllers (how MPPT works), and discrete designs face the gate-drive trade-offs in choosing a MOSFET gate resistor value.
FAQ
What is the duty cycle formula for a boost converter?
For an ideal boost converter in continuous conduction, , so . Texas Instruments recommends for design, because the converter must also supply its own losses. For 3.7 V to 5 V that gives 0.26 ideal and about 0.33 with 90% efficiency.
Why is the input current of a boost converter higher than the output current?
Power in equals power out plus losses. If the output voltage is higher than the input, the input current must be higher than the output current. A 5 V, 1.5 A output from a 3.7 V cell at 90% efficiency draws about 2.25 A from the cell, rising to about 3.1 A when the cell sags to 2.7 V.
What is the maximum voltage gain of a boost converter?
The ideal formula 1/(1 − D) has no limit, but a real converter does. With a total series resistance RL and load R, the gain peaks at and then falls as D increases further. Minimum off time, switch voltage ratings and parasitic capacitance add more limits, so very high ratios use two stages, a coupled inductor or a transformer instead.
What is the right-half-plane zero in a boost converter?
When the controller increases the duty cycle to raise the output, the inductor spends longer disconnected from the output, so the output first dips before it rises. This wrong-way response is a right-half-plane zero at . The control loop bandwidth must stay well below it.
Can you turn off a boost converter by stopping the switch?
Not in the basic circuit. With the switch off, the input still reaches the output through the inductor and diode, so the load sees roughly the input voltage minus a diode drop. Chips that need a true off state add a load-disconnect switch.
Related on The Science 360
Sources
- Texas Instruments, SLVA372D, Brigitte Hauke, "Basic Calculation of a Boost Converter's Power Stage" (duty cycle with efficiency, ripple and switch current): ti.com/lit/an/slva372d/slva372d.pdf
- Texas Instruments, TPS61023 datasheet SLVSF14B (limits, switches, inductor and capacitor equations, application example): ti.com/lit/ds/symlink/tps61023.pdf
- Texas Instruments, TPS61023 product page (94% at 3.6 V to 5 V and 1.5 A, 20 µA quiescent current, load disconnect feature): ti.com/product/TPS61023
- Texas Instruments, SLVA633, "Practical Feedback Loop Analysis for Voltage-Mode Boost Converter" (RHP zero mechanism, fRHP = R(1 − D)2/(2πL), bandwidth must be considerably less): ti.com/lit/pdf/slva633
- Texas Instruments, SLVA274, "Voltage Mode Boost Converter Small Signal Control Loop Analysis Using the TPS61030" (RHP zero dependence on input voltage, load and inductance): ti.com/lit/pdf/slva274
- R. W. Erickson and D. Maksimović, Fundamentals of Power Electronics, Chapter 3 slides (nonideal boost with inductor resistance RL, balance equations, V/Vg versus D curves): Chapter 3 slides PDF
- All About Circuits, "Understanding the Operation of a Boost Converter" (typical page-one explanation): allaboutcircuits.com
Method note: Figures 2, 3 and 4 are computed directly from the equations in the text. Figure 5 is our numerical integration of the standard averaged boost model (inductor and capacitor state equations with 0.07 Ω series resistance) using a 1 ns time step. The conduction-loss budget, the gain-peak algebra and the parasitic-capacitance examples are our own calculations.
Header image: NASA/JPL-Caltech (image PIA23131), regraded for this article.