Nyquist Theorem: Why Twice the Frequency Isn't Enough

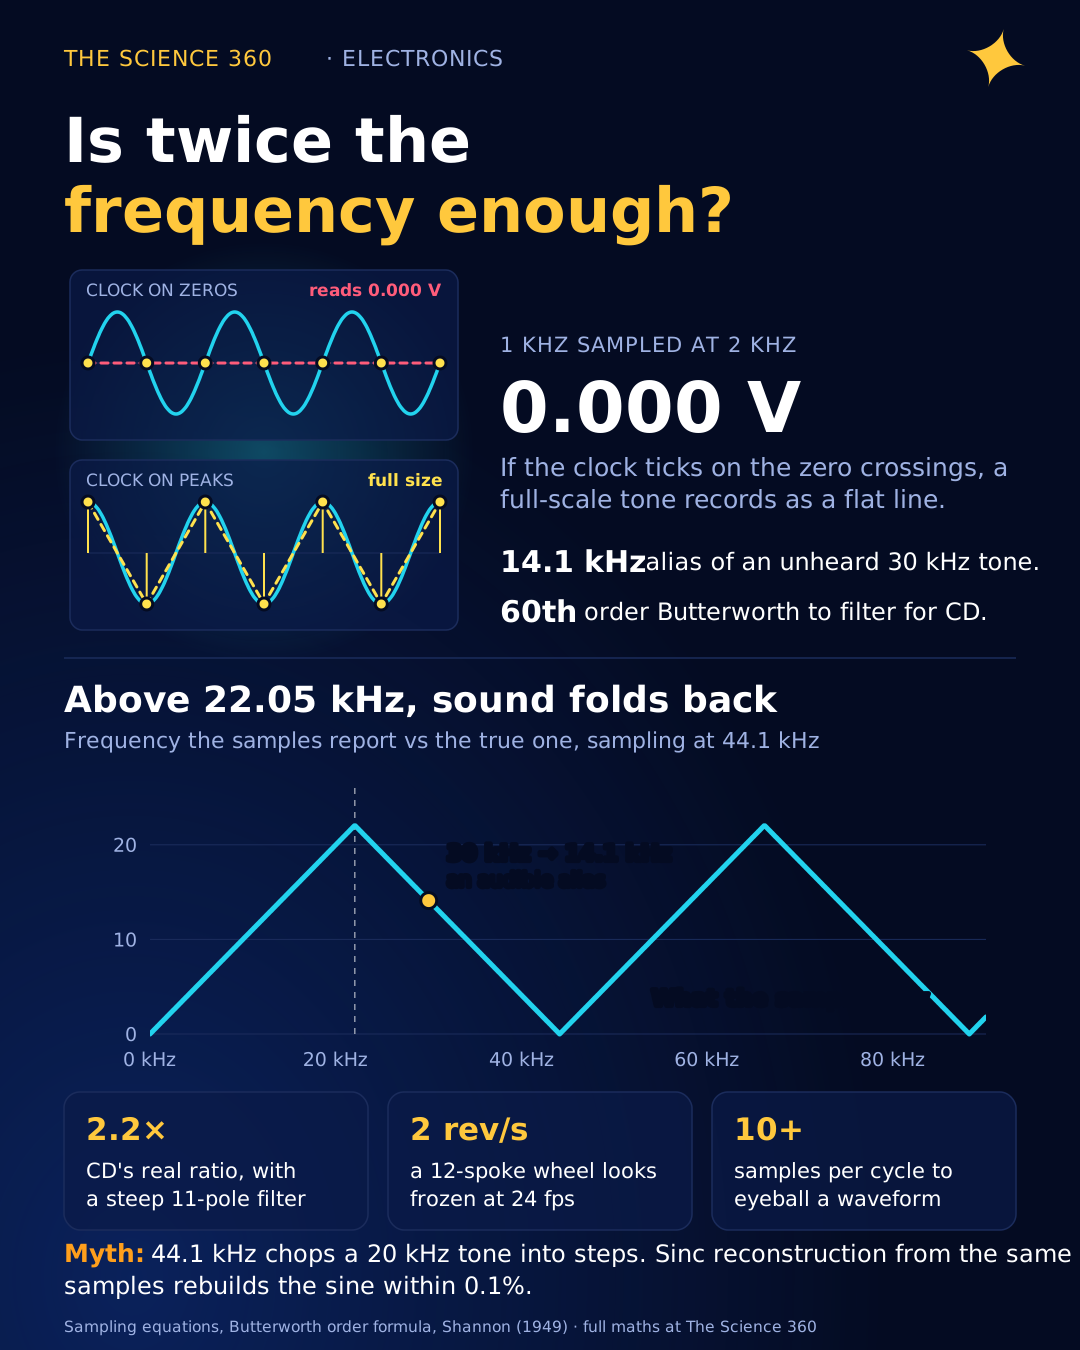
Take a 1 kHz sine wave and sample it at exactly 2 kHz, the rate that "twice the frequency" tells you is enough. If your sample clock happens to tick at the zero crossings, every single sample reads 0.000 V. Your recording of a full-scale tone is a flat line. Shift the clock by a quarter of a cycle and you capture the peaks at full size. Anywhere in between, you get a sine that is too small by an amount you cannot know.
Most pages that rank for this question say "sample at least twice the highest frequency" and stop. The rule is real, but "at least" is wrong, "highest frequency" is a simplification, and the factor of two is a floor that no practical system runs at. Here is where the two comes from, what happens at and above it, and how much faster you actually need to sample.
Where does the factor of two come from?
One sample tells you the value of the signal at one instant and nothing about what it did in between. So ask which sinusoids pass through a given set of samples taken every seconds. Write a cosine at frequency f and evaluate it only at the sample times :
Replace f by :
because is a whole number. Replace f by :
because cosine is even. So all give the same samples.
Every frequency has an infinite family of impostors that produce the same numbers, and the samples cannot say which one was really there. The only way to make the answer unique is to promise, in advance, that the signal lives in a range where each family has exactly one member. The ranges 0 to , to , to and so on each contain one representative of every family, and the lowest one is the natural choice. Hence the rule: keep everything below , the Nyquist frequency, or equivalently sample faster than twice the highest frequency, the Nyquist rate.
In frequency-domain language: sampling repeats the spectrum at every multiple of fs, a band from −B to +B is 2B wide, and the copies overlap unless .
Why does sampling at exactly twice the frequency fail?
The edge case is where the copies "just touch", and it is worth doing with numbers because it shows why the inequality has to be strict. Let the tone sit exactly at , with amplitude A and an unknown phase φ:
At :
since . So:
The samples alternate +c, −c, +c, −c, and the only thing they record is the product . A 1 V cosine () gives ±1.00. A 1.41 V tone at gives the same ±1.00. A 10 V sine () gives all zeros. Figure 1 shows three of these cases. Two numbers, amplitude and phase, have been squeezed into one, and the information is gone.
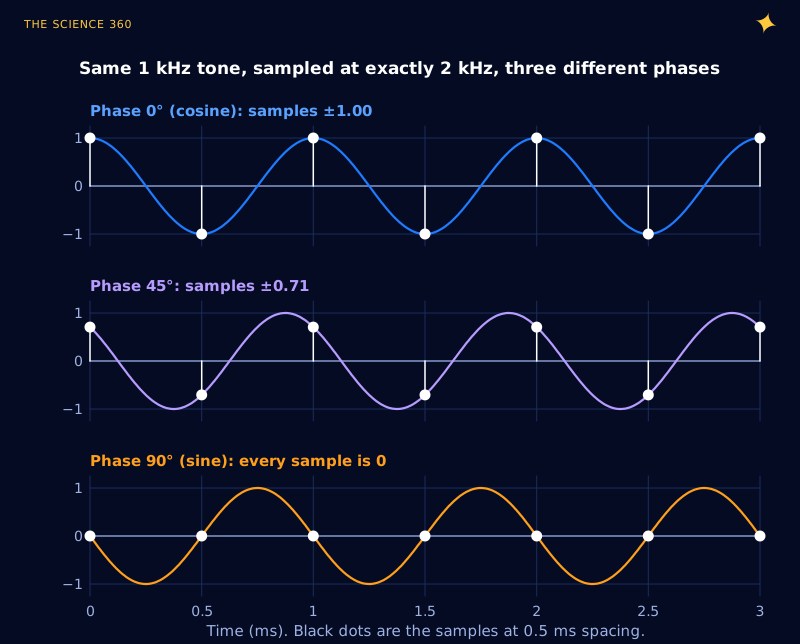
Shannon's own 1949 statement in the Proceedings of the IRE reads: "If a function f(t) contains no frequencies higher than W cps, it is completely determined by giving its ordinates at a series of points spaced 1/2W seconds apart." Read literally, "no higher than W" allows a component at exactly W, and Figure 1 is the counterexample. Modern statements require strictly: twice is the boundary, not a working point. Shannon also credited the idea in approximate form to Harry Nyquist, whose 1928 paper "Certain topics in telegraph transmission theory" gave the name we now use.
What is aliasing, and where does a frequency end up?
When a tone breaks the rule, it does not disappear. It shows up as a different, lower frequency, the member of its family that lies between 0 and . That impostor is called an alias. Figure 2 is the classic demonstration: a 7 kHz tone sampled at 8 kHz.
Alias frequency: , with k the whole number that makes .
7 kHz sampled at 8 kHz, k = 1:
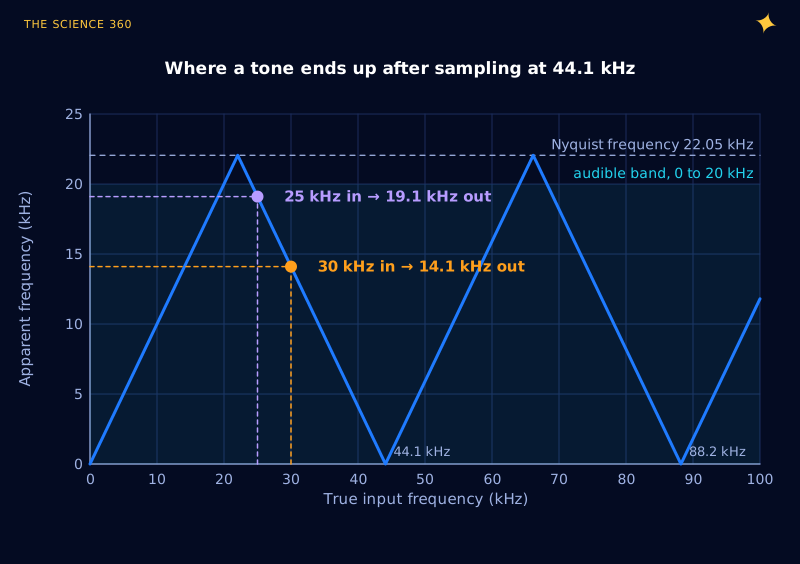
30 kHz sampled at 44.1 kHz, k = 1:
50 kHz sampled at 44.1 kHz, k = 1:
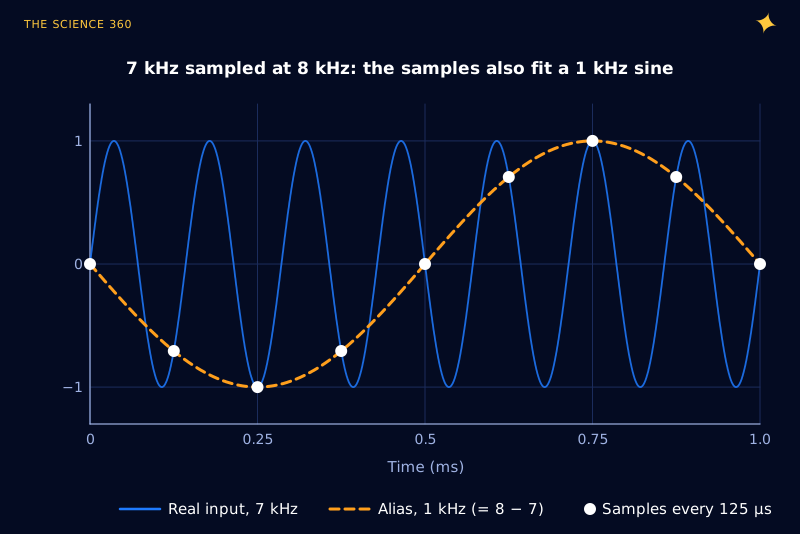
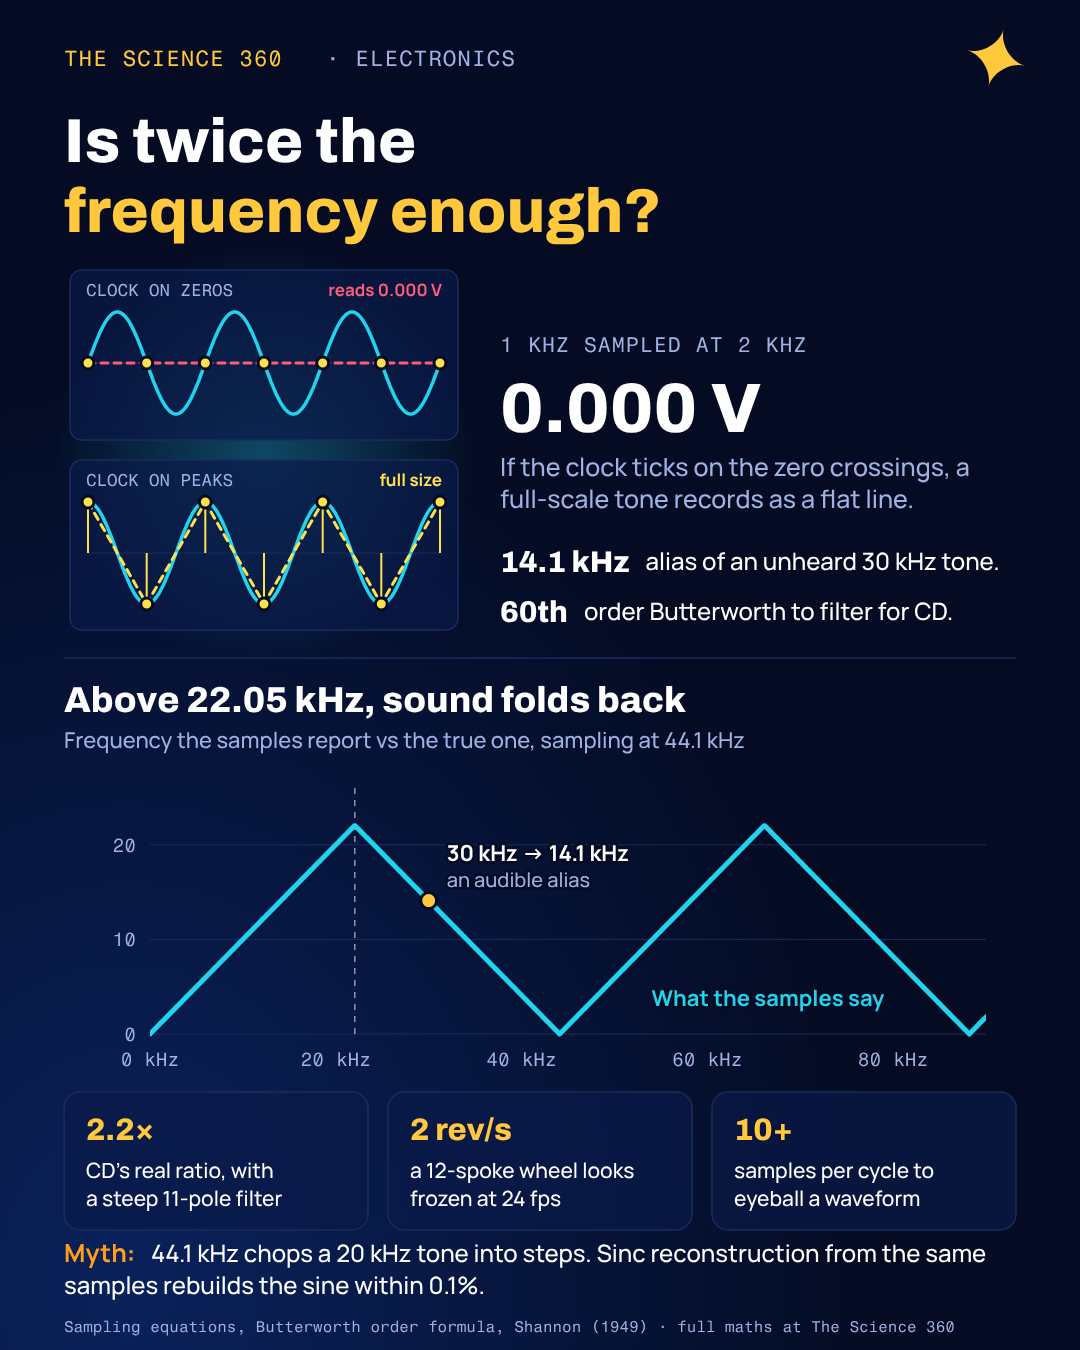
The mapping from true frequency to apparent frequency is a triangle wave, shown in Figure 3 for the CD rate. Frequencies rise normally up to 22.05 kHz, then fold back down, hit zero at 44.1 kHz, rise again and keep zig-zagging. Engineers call this folding, and it is why the Nyquist frequency is sometimes called the folding frequency. Note what the 30 kHz example means in practice: an ultrasonic tone nobody can hear becomes a 14.1 kHz whistle that everyone can.
Two consequences are easy to miss. First, aliasing cannot be undone after the fact. The 14.1 kHz alias and a genuine 14.1 kHz note give identical numbers, so a digital filter downstream has no handle to grab. The only cure is an analog low-pass filter in front of the ADC, which is why it is called an anti-alias filter (the same RC math as in our post on the RC low-pass filter cutoff, scaled up to many poles). Second, aliasing also hits noise. Broadband noise from DC to 1 MHz, sampled at 44.1 kHz with no filter, folds every slice of that megahertz into the 0 to 22 kHz band, which raises the noise floor even when there are no ultrasonic tones at all.
Why the “wagon wheel” spins backwards
A film camera is a sampler with fs equal to its frame rate, and a spoked wheel is a periodic signal. The aliasing math explains the old Western stagecoach scene exactly. Take a 12-spoke wheel filmed at 24 frames per second. The pattern repeats every 1/12 of a turn, so the "signal frequency" is 12 times the rotation rate.
Pattern frequency is (rev/s). The wheel looks frozen when the pattern frequency is 24 Hz:
With a 0.65 m tyre:
At 1.8 rev/s:
so the spokes creep backwards at rev/s.
At 2.2 rev/s:
so the spokes creep forwards at 0.2 rev/s.
The negative sign is the thing to notice. An alias carries direction as well as frequency, and for a rotating pattern that shows up as reversed motion. A strobe "freezing" a spinning pulley is the same arithmetic.
How much faster than twice do you really need to sample?
The theorem assumes a brick-wall filter that passes everything below and nothing above. That filter cannot be built (its impulse response stretches infinitely into the past), so real filters roll off over a transition band, and the width of that band sets the practical sample rate.
Worked example: the anti-alias filter for CD audio. Suppose you want to keep 0 to 20 kHz and want any aliases landing in that band to sit 96 dB down, about the range of 16-bit audio. Using Figure 3, a frequency only folds into 0 to 20 kHz if it is above . So the filter must be flat-ish at 20 kHz and 96 dB down at 24.1 kHz.
Butterworth magnitude, with (the −3 dB point):
Need 96 dB at 24.1 kHz:
Butterworth order needed: 60 (a hopeless analog filter)
Elliptic filter, 0.1 dB passband ripple, same corners (our scipy calculation): 11th order
At 48 kHz:
which gives Butterworth 33, elliptic 10.
Even the elliptic answer is an eleven-pole analog filter with tight tolerances and ugly phase near 20 kHz. Figure 4 shows how fast the problem eases as the sample rate rises.
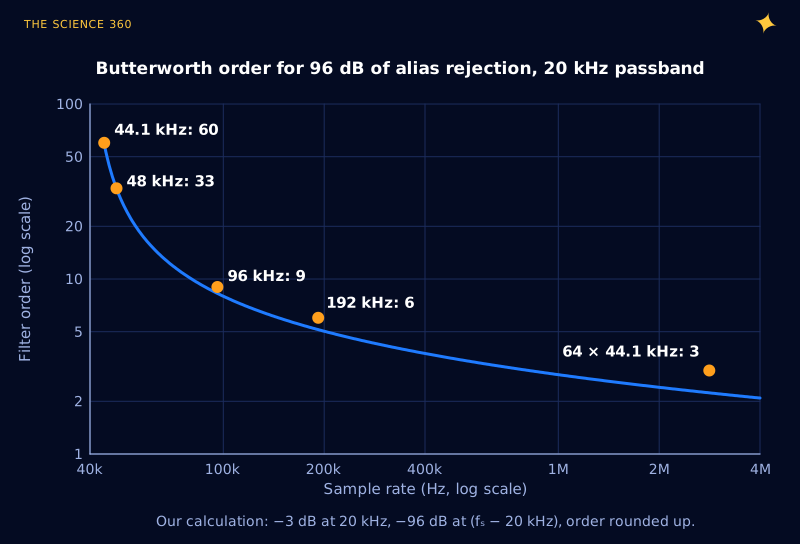
This is why nearly every modern audio ADC is a delta-sigma converter that samples internally at many megahertz. At the first alias band starts around 2.8 MHz, and the ratio becomes :
A one-pole RC gets you a good part of the way.
The steep filtering then happens in the digital domain, where an extra hundred filter taps cost silicon area rather than precision capacitors. TI's ADS131M08 datasheet makes exactly this argument for its own delta-sigma ADC: because the integrated digital filter strongly attenuates everything except the region near the modulator frequency, "a single-order RC filter provides sufficient antialiasing protection in the vast majority of applications". A legacy National Semiconductor note now hosted by TI (SNOA350) puts numbers on the contrast: a Nyquist-rate ADC's filter "typically must have a flat response up to about and attenuate all frequencies above " to below the noise floor, while a 64× oversampling converter pushes the critical attenuation point out by a factor of 127. The sample rate you end up storing is still 44.1 or 48 kHz. Oversampling just moves the hard work to where it is cheap. It is also one of the tricks behind the noise numbers in our post on ADC resolution versus accuracy.
Why is CD audio 44.1 kHz and not 40 kHz?
Human hearing is usually quoted as reaching about 20 kHz, so the Nyquist rate is 40 kHz. The extra 4.1 kHz is the filter's transition band: 44.1 kHz leaves a 2.05 kHz gap between 20 kHz and the Nyquist frequency of 22.05 kHz, and, as worked above, frequencies up to 24.1 kHz can be attenuated without their aliases reaching the audio band. Without that margin, Figure 4's curve goes vertical.
The oddly specific value comes from history. Early digital audio masters were stored as black-and-white video on video recorders, through "PCM adaptors". The rate had to fit a whole number of samples into each usable video line:
Usable lines per field × fields per second × samples per line:
The same number works for both television systems. It also factorises prettily: .
The staircase myth: does 44.1 kHz chop a 20 kHz tone into steps?
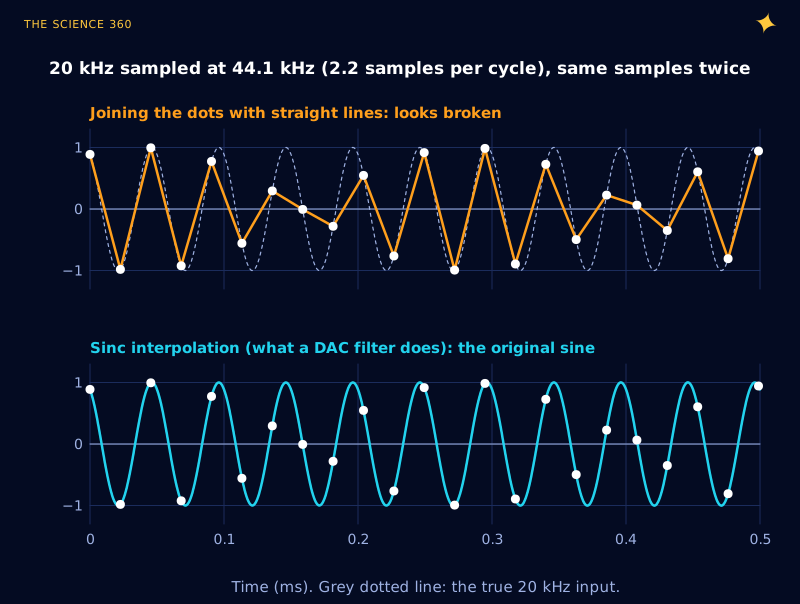
The second misconception sits on the output side. Join the dots of a 20 kHz tone sampled at 44.1 kHz and you get a wobbling, half-broken wave with what looks like a 4.1 kHz beat (Figure 5, top). People see that plot and conclude that high frequencies on a CD are crude approximations.
But joining dots is not what the theorem says to do. The Whittaker-Shannon reconstruction places a sinc pulse, , at every sample and adds them up. A real DAC approximates this with its reconstruction filter. Do that with the same samples and the original 20 kHz sine comes back (Figure 5, bottom). In our simulation, using 4,000 samples, the reconstructed wave matches the true sine to within 0.1% in the window shown. The information was always there; straight lines just are not the right way to read it.
Joining the dots is still how most plotting tools draw sampled data, so it is useful to know how wrong it can be. The worst-case error is at a peak that falls halfway between two samples:
k = samples per cycle; samples either side of the peak sit at radians.
That is the rule of thumb for eyeballing waveforms: if you want the picture to look like the signal without sinc reconstruction, aim for 10 or more samples per cycle. Our post on the 10x oscilloscope probe covers the analog front end that sits before the scope's sampler.
Is it the highest frequency or the bandwidth that matters?
Strictly, it is the bandwidth. The "highest frequency" version is the special case where the band starts at 0 Hz. A signal confined between 100 and 102 MHz, like an FM broadcast channel, occupies only 2 MHz of spectrum. Wikipedia's treatment of non-baseband sampling uses exactly that example: sampling at 4 MHz is enough. The alias formula shows why: with , 100.5 MHz lands at 0.5 MHz and 101.5 MHz at 1.5 MHz, so the whole channel folds onto 0 to 2 MHz without overlapping itself.
Software-defined radios use this deliberately (bandpass sampling, or undersampling). It only works when the band sits in the right place relative to multiples of , and it still needs a bandpass filter to keep the other zones of Figure 3 empty. Aliasing is a deterministic mapping: you either prevent it or exploit it.
A checklist for choosing a sample rate
A working engineer's version of the theorem:
- Decide the bandwidth B you actually care about, not the highest frequency that might be present.
- Decide how far down aliases must be, usually to the noise floor of the converter (about 6 dB per bit).
- Pick fs so that leaves room for a filter you can build. For a simple two- or three-pole filter that typically means 5 to 10 times B, or a delta-sigma ADC that oversamples internally.
- Remember that interference counts too. Mains hum at 50 or 60 Hz and its harmonics (see why mains is 50 or 60 Hz) and switching regulator noise at hundreds of kilohertz will alias down to wherever Figure 3 sends them.
- If you only need to look at a waveform, plan for 10 or more samples per cycle.
If the anti-alias filter is an active one, the op-amp's bandwidth limits how well it rejects at high frequency, which is where the gain-bandwidth product comes in. Sampled audio loops such as noise-cancelling headphones add a further constraint: every filter adds delay.
FAQ
Why do you need to sample at twice the frequency?
Sampling makes every frequency f indistinguishable from . Only if all of the signal sits below half the sample rate do those copies avoid landing on top of each other, so the original can be rebuilt uniquely. The real requirement is strictly more than twice the bandwidth, with margin for the anti-alias filter.
What happens if you sample at exactly the Nyquist rate?
A tone at exactly produces samples of . A cosine is captured at full size, a sine aligned with the clock gives all zeros, and anything in between is shrunk. You cannot recover the amplitude and phase, which is why the theorem needs a strict inequality.
Why is CD audio sampled at 44.1 kHz?
44.1 kHz gives a 2.05 kHz gap above the 20 kHz audio band for the anti-alias filter to work in. The exact number comes from early digital audio stored on video recorders: 3 samples per line on 294 lines at 50 fields per second, or 245 lines at 60 fields per second, both equal 44,100 samples per second.
Can aliasing be removed after sampling?
Not in general. Once a 30 kHz tone has been sampled at 44.1 kHz it produces exactly the same numbers as a real 14.1 kHz tone, so no digital filter can tell them apart. Aliasing has to be prevented with an analog low-pass filter before the ADC.
Why do wheels look like they spin backwards on video?
The camera samples the wheel at its frame rate. A 12-spoke wheel filmed at 24 frames per second looks frozen at exactly 2 revolutions per second, because each spoke moves to the next spoke's position between frames. Slightly slower and each spoke falls just short, so the pattern appears to creep backwards.
Related on The Science 360
Sources
- C. E. Shannon, "Communication in the Presence of Noise", Proc. IRE 37(1), 1949, reprinted Proc. IEEE 86(2), 1998 (Theorem 1 wording, credit to Nyquist and Gabor): reprint PDF (University of Miami)
- Wikipedia, "Nyquist-Shannon sampling theorem" (strict inequality, the critical-frequency family, 100 to 102 MHz bandpass example): en.wikipedia.org/wiki/Nyquist-Shannon_sampling_theorem
- Wikipedia, "44,100 Hz" (2.05 kHz transition band, PAL 294 × 50 × 3 and NTSC 245 × 60 × 3, citing Watkinson, The Art of Digital Audio, 1989): en.wikipedia.org/wiki/44,100_Hz
- Henning Schulzrinne, Columbia University, "Explanation of 44.1 kHz CD sampling rate" (video line arithmetic, filter margin, 22325272): cs.columbia.edu/~hgs/audio/44.1.html
- Texas Instruments, ADS131M08 datasheet, antialiasing section ("a single-order RC filter provides sufficient antialiasing protection"): ti.com ADS131M08 datasheet
- Texas Instruments (National Semiconductor legacy), SNOA350, on oversampling converters and relaxed anti-alias requirements: ti.com/lit/pdf/snoa350
Method note: Figures 1 to 3 and 5 are computed directly from the sampling equations with numpy. Figure 5's reconstruction sums unwindowed sinc pulses over 4,000 samples. Filter orders in Figure 4 and the text are our calculations from the Butterworth formula; elliptic orders are from scipy.signal.ellipord with 0.1 dB passband ripple and 96 dB stopband.
Header image: NASA/JPL-Caltech/ASU/MSSS (image PIA25881), regraded for this article.