RC Low Pass Filter Cutoff Frequency: What −3 dB Means

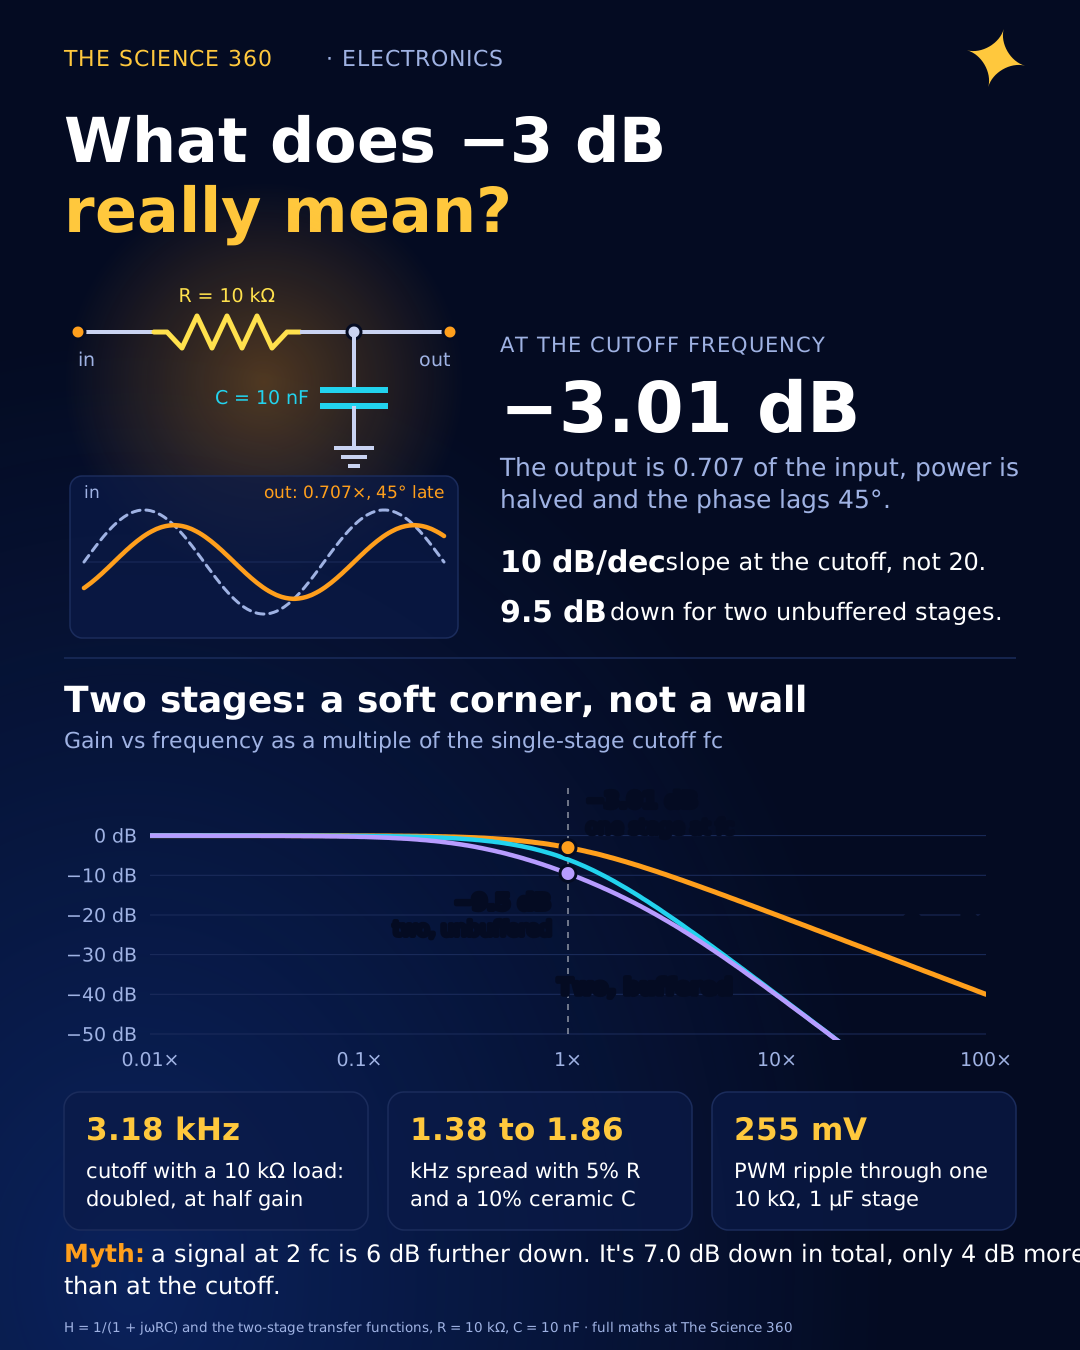
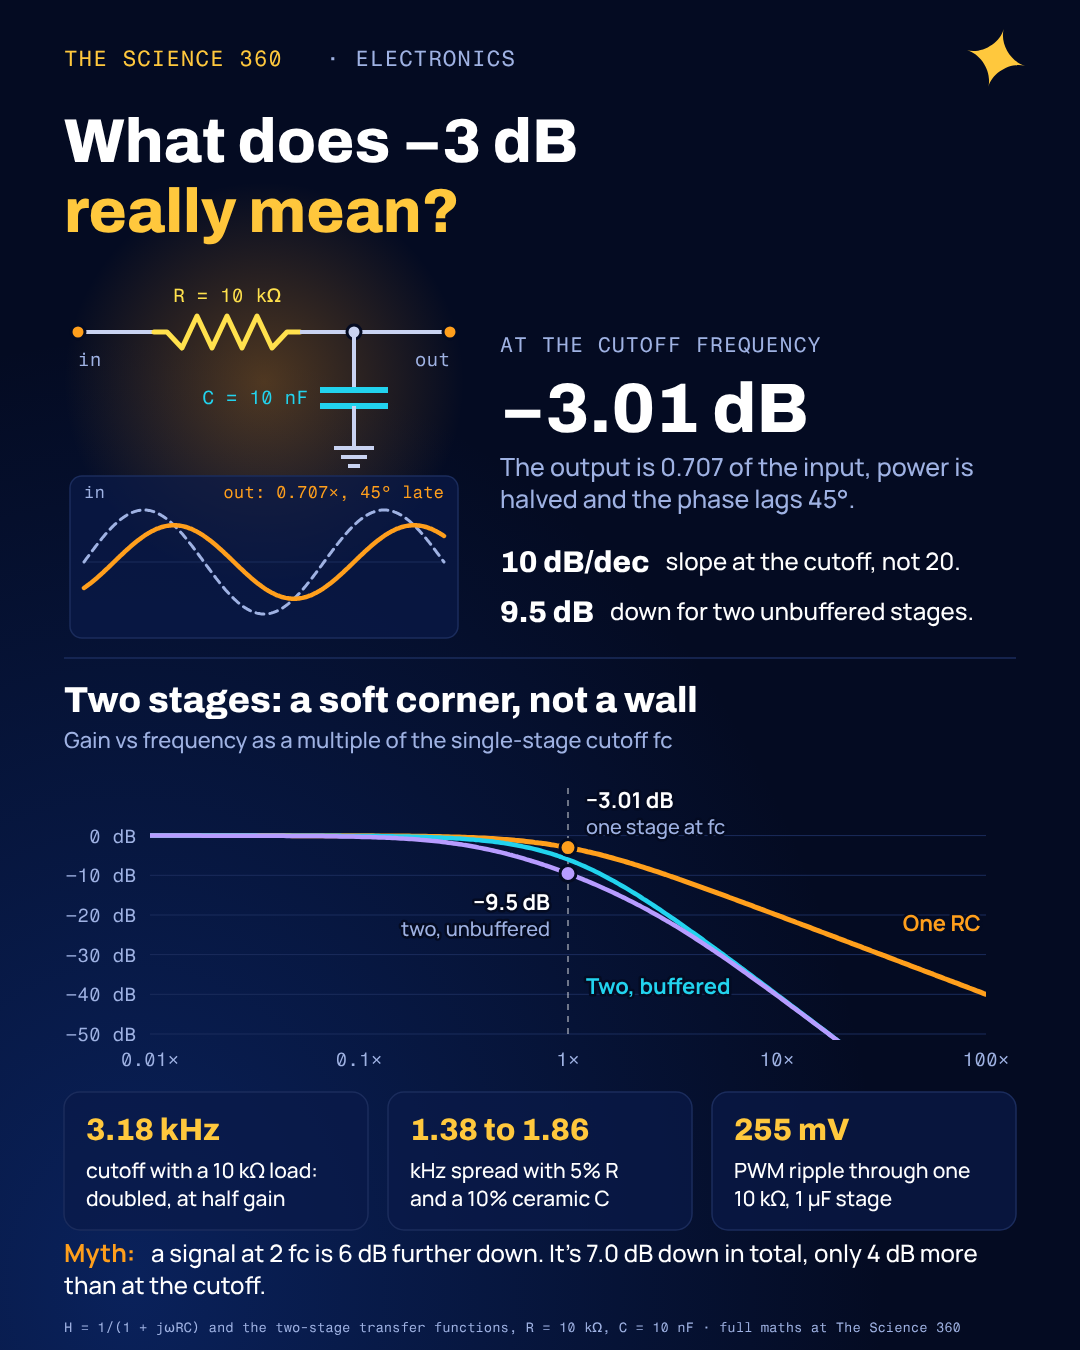
Build a 10 kΩ and 10 nF low-pass filter, feed it a 1.59 kHz sine and put a scope on the output. You do not see a filter that has started to cut. You see an output at 70.7% of the input, lagging by 45°, and a response that at that exact frequency is falling at only 10 dB per decade, half of the famous 20. Then plug in the next stage and the cutoff moves. Everything on the first page of results gives the formula and stops. This post covers what the number means, where the "20 dB/decade" and "40 dB/decade for two stages" rules break, and how to design around them.
Where does fc = 1/(2πRC) come from?
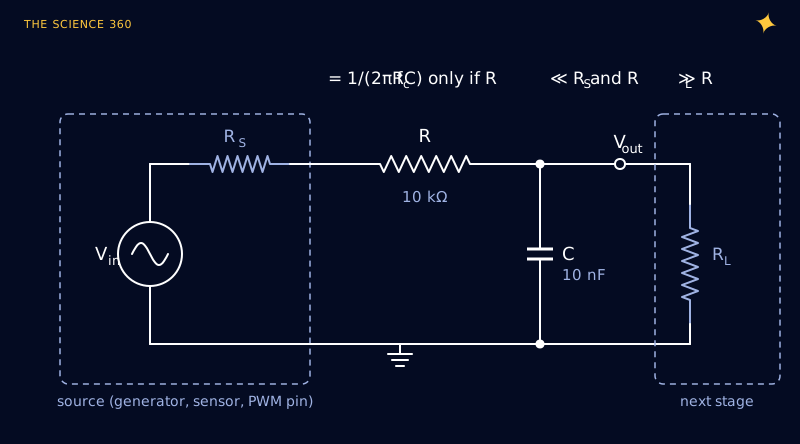
The circuit is a voltage divider made of a resistor and a capacitor (Figure 1). The capacitor's impedance is , with , so the output is:
Everything interesting happens when , which is when the capacitor's reactance 1/(ωC) equals R. Then the denominator is 1 + j, whose magnitude is √2 and whose angle is 45°:
The 0.500 is the power ratio, because power into a fixed load goes as V². Example, R = 10 kΩ, C = 10 nF:
So "−3 dB", "half power" and "0.707" are the same statement in three units. The half-power version needs one caveat: it compares power delivered to the same resistance, so it is about voltage squared, not about how much power the RC itself dissipates. The 3 dB is also a rounded 3.0103 dB, which is why some datasheets write "−3 dB" and others "−3.01 dB".
The time constant is the same quantity seen from the time domain. τ = 100 µs here, and the step response reaches 63% in one τ, as covered in why the RC time constant is 63 percent. The two views are tied together by a handy rule: the 10 to 90% rise time is 2.2τ, which equals 0.35/fc, or 220 µs for this filter.
What does the Bode plot look like around fc?
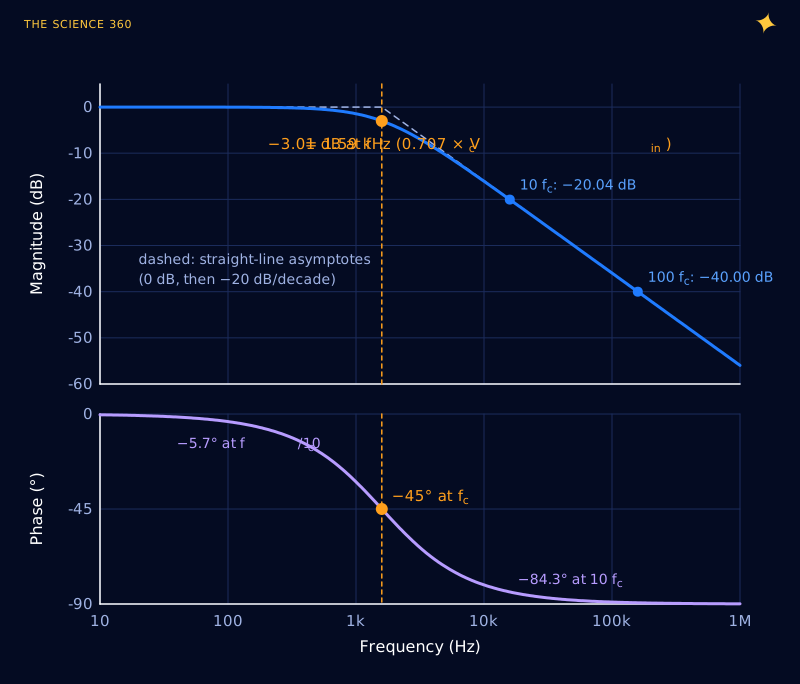
Figure 2 plots the exact response for 10 kΩ and 10 nF. The dashed lines are the straight-line asymptotes that every tutorial draws: flat at 0 dB below fc, then falling at 20 dB/decade. They meet exactly at fc, and the real curve sits 3.01 dB below the corner where they meet. That is the largest error of the asymptotic sketch; one decade either side, it is only 0.04 dB.
The table every designer ends up computing:
Each row gives |H|, the gain in dB and the phase, at 159 Hz, 1.59 kHz, 15.9 kHz and 159 kHz.
Is the slope really 20 dB per decade?
Only far above fc. Differentiate the exact magnitude in decibels with respect to log10f, writing , and you get the local slope (our derivation):
In dB per decade:
This is the misconception that bites most often. People read "20 dB/decade above cutoff" and expect a signal at 2fc to be 6 dB down. It is 7.0 dB down in total, but only 4 dB further than at fc. A first-order filter is a gentle slope, not a wall, and if you need real rejection close to the passband you need a higher-order filter.
How does the next stage change the cutoff?
The formula assumes an ideal voltage source driving the filter and nothing at all hanging on the output. Real circuits break both assumptions.
Source resistance adds to R. The source's internal resistance is in series with R, so the effective resistance is R + RS. A 600 Ω audio output driving our filter:
That is harmless here. It is not harmless when R is small: a 100 Ω resistor with a 50 Ω source gives a cutoff 33% low.
A load resistance across C changes two things. Replace the source and R with their Thevenin equivalent and the answer drops out (our algebra, standard circuit theory):
RL = 10 kΩ (equal to R): gain 0.5 (−6.0 dB), and the cutoff doubles to 3.18 kHz.
RL = 100 kΩ (10 × R): gain 0.909 (−0.83 dB), and the cutoff is 1.75 kHz, 10% high.
The usual guideline is to make the load at least ten times R, which gives the 10% error above. If that is not possible, put an op-amp follower after the capacitor. A follower has its own bandwidth limit, which the gain-bandwidth product sets, but at unity gain it is rarely the bottleneck for an RC filter.
A microcontroller ADC is a special kind of load. The ATmega328P datasheet says its ADC "is optimized for analog signals with an output impedance of approximately 10k or less", because each conversion has to charge an internal sample-and-hold capacitor through the source resistance. The same datasheet tells you to remove frequencies above Nyquist with a low-pass filter before the pin. An RC anti-alias filter with 100 kΩ satisfies the second sentence and violates the first. Keep R modest, or make C large compared with the sample-and-hold capacitor so it can supply the charge. The background is in why Nyquist means more than twice the frequency and ADC resolution versus accuracy.
Do two RC stages give 40 dB per decade?
Far above cutoff, yes. Near cutoff, no, and how far off depends on whether the stages load each other. For two identical sections (R, C, R, C) there are three cases, all computed from the transfer functions below (our derivation) and plotted in Figure 3.
Buffered (op-amp follower between stages):
Unbuffered ladder:
Unbuffered, second stage at 10× impedance (R2 = 10R, C2 = C/10):
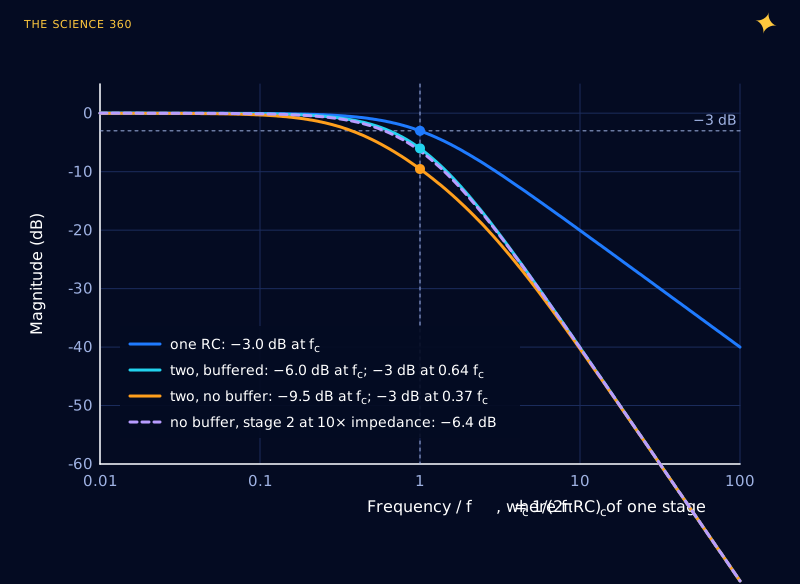
So the correct statement is: two isolated identical stages are 6 dB down at the single-stage fc, and loading makes it worse, 9.5 dB for identical unbuffered stages. If you want a two-stage filter with its −3 dB point at a particular frequency, you must design each stage for a higher fc: times higher when buffered, or 2.67 times when unbuffered and identical. Scaling the second stage's impedance up by ten recovers nearly the buffered response without an op-amp, which is the cheap trick worth remembering.
Even buffered, two real poles never give a sharp corner. Active filters (Sallen-Key, multiple feedback) use feedback to place complex poles and get a Butterworth response that stays flat until near fc and is exactly −3 dB there. That is the point at which an RC ladder stops being the right tool.
Worked example: turning Arduino PWM into a DC voltage
The most common RC low-pass filter on a hobby bench sits on a PWM pin to make a crude DAC. Arduino's reference lists 490 Hz for most PWM pins on the Uno (980 Hz on pins 5 and 6). Take a 5 V, 50% duty signal, a 2.5 V average, and try to remove the ripple.
Single RC, R = 10 kΩ, C = 1 µF: τ = 10 ms, fc = 15.9 Hz. 490 Hz is 30.8 fc.
That is about 0.21 V peak to peak from the fundamental of the 5 V square wave. The triangle approximation, valid for τ ≫ period:
A time-step simulation of the circuit (Figure 4) agrees: 255 mV peak to peak, about 10% of the output. The obvious fix, a bigger capacitor, trades ripple for speed. With 4.7 µF our simulation gives 54 mV of ripple but takes about 0.21 s to settle within 1%. The better fix is a second stage at ten times the impedance, 100 kΩ and 100 nF, on the same 10 kΩ and 1 µF:
Single 10 kΩ / 4.7 µF: ripple 54 mVpp, settles in about 214 ms
Two stages, + 100 kΩ / 100 nF: ripple 6.5 mVpp, settles in about 72 ms
(our simulation; "settled" = within 1% of 2.5 V plus half the ripple)
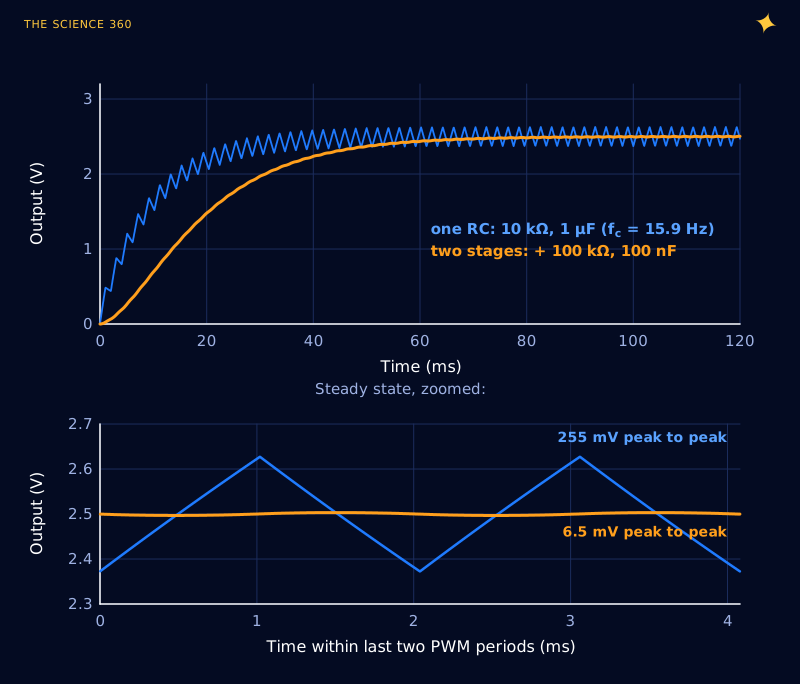
Two stages give 40 times less ripple than one, for about 60% more settling time, and beat the single 4.7 µF stage on both counts. That is the 40 dB/decade slope earning its keep where it applies: at 30 times the cutoff, far out on the asymptote. Remember the output still has a source resistance of about 110 kΩ, so anything reading it must have a high input impedance, or a buffer. The same RC charging behaviour underlies button debounce circuits and the timing in the 555 timer formula.
How accurate is the cutoff with real parts?
fc is inversely proportional to both R and C, so the tolerances multiply. A 5% resistor and a 10% ceramic capacitor give:
So a nominal 1.59 kHz filter lands anywhere from 1.38 to 1.86 kHz.
Class 2 ceramics such as X7R also lose capacitance with applied DC voltage and temperature, the same effect discussed in why 100 nF is the standard decoupling capacitor. For filters that must hit a frequency, use C0G/NP0 capacitors and 1% resistors, and keep the corner well away from any frequency you care about. A first-order filter with a ±15% corner is fine for smoothing PWM and useless as a precision anti-alias filter.
FAQ
What is the cutoff frequency of an RC low-pass filter?
. At that frequency the capacitor's reactance equals R, the output amplitude is 1/√2 = 0.707 of the input (−3.01 dB), the power delivered to a fixed load is halved and the output lags by 45°. For 10 kΩ and 10 nF, fc = 1.59 kHz.
Why is the cutoff frequency defined at −3 dB?
Because it is the frequency where the resistive and reactive parts of the impedance are equal, so the output voltage is 1/√2 of the input and the power is exactly half. In decibels that is . It is also where the two straight-line asymptotes of the Bode plot meet.
Does cascading two RC filters give 40 dB per decade?
Eventually, far above cutoff. But two identical RC stages without a buffer are already 9.5 dB down at the single-stage cutoff and reach −3 dB at only 0.37 times it. With a buffer between them they are 6.0 dB down at fc and −3 dB at 0.64 fc. The corner is soft either way.
How does a load change an RC filter’s cutoff?
A load resistance RL across the capacitor forms a divider with R. The DC gain drops to and the cutoff rises to . A 10 kΩ load on a 10 kΩ, 10 nF filter halves the output and doubles fc from 1.59 to 3.18 kHz. Any source resistance simply adds to R.
Related on The Science 360
Sources
- Arduino, analogWrite() language reference (PWM frequency 490 Hz, 980 Hz on Uno pins 5 and 6): github.com/arduino/reference-en analogWrite.adoc
- Microchip (Atmel), ATmega328P automotive datasheet, 7810D, section 23.6.1 Analog Input Circuitry (ADC optimised for source impedance of about 10 kΩ or less; low-pass filter recommended before the input): microchip.com ATmega328P datasheet PDF
- Virtual Labs, IIT Kharagpur, "RC Frequency Response" theory page (cutoff as the −3 dB frequency, 50% power, phase −arctan(2πfRC)): be-iitkgp.vlabs.ac.in frequency response
- Redcrab Software, RC low pass filter calculator (typical page-one calculator): redcrab-software.com RC low pass filter
- Flux, "RC Low Pass Filter" blog (page-one tutorial covering the formula and 20 dB/decade roll-off): flux.ai/p/blog/rc-low-pass-filter
Method note: all magnitudes, phases and slopes are evaluated from the transfer functions given in the text. Figure 4 and the PWM ripple and settling numbers come from our own time-step simulation of the RC ladder with an ideal 0 to 5 V PWM source and no load.
Header image: NASA/Terry Virts (image iss043e125478), regraded for this article.