How Does LIGO Detect Gravitational Waves? The Real Numbers
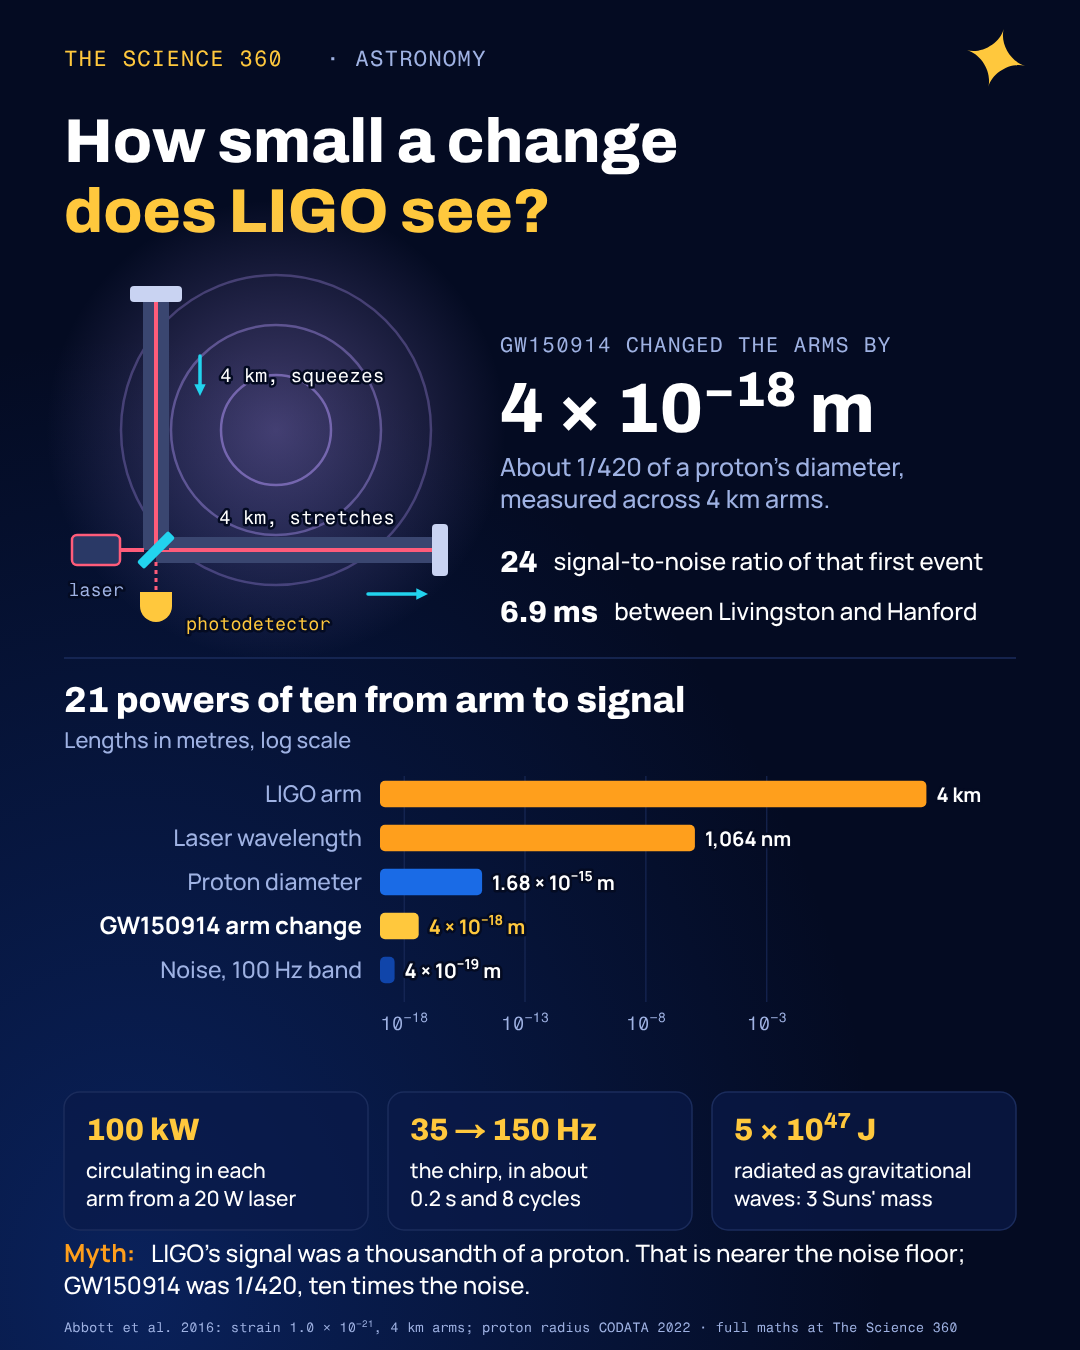
On 14 September 2015 at 09:50:45 UTC, two mirrors hanging at the far ends of a 4 km vacuum tube in Louisiana moved relative to two others by about 4 × 10⁻¹⁸ metres. Seven milliseconds later the same pattern showed up in Washington State. The motion came from two black holes, 36 and 29 times the mass of the Sun, merging 1.3 billion light years away. The whole signal lasted about a fifth of a second.
You will usually read that LIGO measures changes "a thousandth of the width of a proton" and then that it uses lasers and mirrors. Both are roughly true, and neither tells you how a pair of L-shaped tubes turns spacetime itself into a voltage, why the first detection was actually several times bigger than that headline figure, or why the obvious objection (the gravitational wave should stretch the laser light too, so how can light measure the stretch?) does not sink the whole idea. This post works through all three with real numbers.
What does a gravitational wave actually do to the detector?
A gravitational wave is a ripple in the geometry of spacetime that travels at the speed of light. Its size is a dimensionless number called the strain, h. If a wave passes straight through the detector with the right orientation, it stretches distances along one direction by a fraction h/2 and squeezes them along the perpendicular direction by h/2, then reverses half a cycle later. LIGO's two arms sit at right angles, so one grows while the other shrinks, and the detector reads the difference:
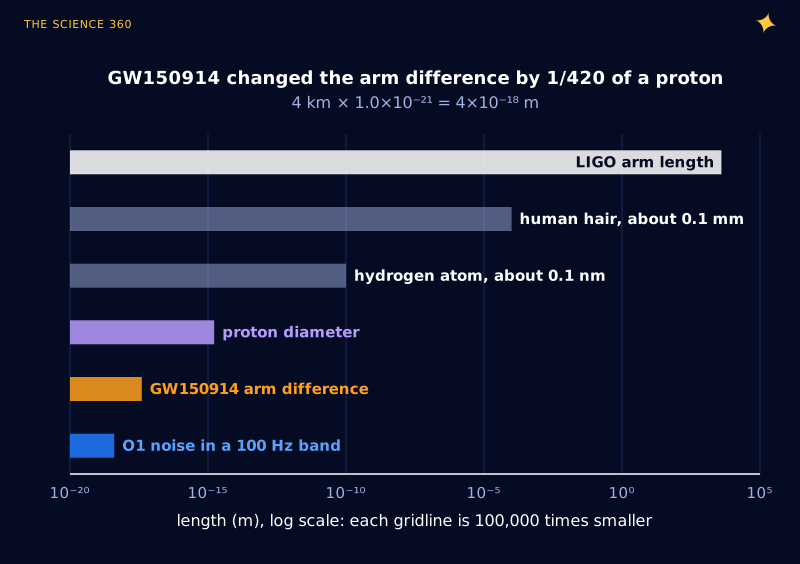
For GW150914: , .
Proton charge radius (CODATA 2022): 8.41 × 10⁻¹⁶ m, so a diameter of 1.68 × 10⁻¹⁵ m.
That is 1/420 of a proton diameter, or about 1/210 of its radius.
That matches the LIGO collaboration's own description of the event: "about one 200th of a proton radius". The strain is fixed by the source and the distance, so longer arms give a proportionally bigger ΔL. That is the whole reason the arms are kilometres long, and why the planned next-generation detectors talk about 10 km to 40 km.
The mirrors are the "test masses": 40 kg discs of fused silica, each hanging at the bottom of a four-stage pendulum so that, at the frequencies LIGO listens to (tens to hundreds of hertz), they behave like objects floating freely in space. A gravitational wave does not push them. It changes the distance between them while they sit still.
How the interferometer turns length into light
The core of LIGO is a Michelson interferometer, the same instrument Michelson and Morley used in 1887. A beam splitter sends half the laser light down each arm. Mirrors at the ends send it back, and the two returning beams recombine at the beam splitter. LIGO is tuned so that the returning beams cancel exactly toward the photodetector, a "dark fringe". All the light goes back toward the laser instead.
If the arm lengths change by different amounts, the cancellation becomes imperfect and a little light reaches the photodetector, in proportion to the strain. The photodetector current is the gravitational-wave signal. For a bare Michelson, the phase difference produced is tiny:
Phase shift in a plain Michelson
Laser wavelength . The round trip doubles the path difference:
With the arm cavities (the detector paper's factor of 300)
Two upgrades on the simple Michelson make that measurable. First, each arm is a Fabry-Pérot cavity: a partly transmitting input mirror sits near the beam splitter, so light bounces back and forth many times before it leaks out. The LIGO papers describe this as multiplying the effect of a gravitational wave on the light phase by a factor of 300. Second, because the output port is dark, nearly all the light heads back to the laser, where a power-recycling mirror sends it back in. That builds up the power: 20 W from the laser becomes about 700 W on the beam splitter and about 100 kW circulating in each arm during the first observing run.
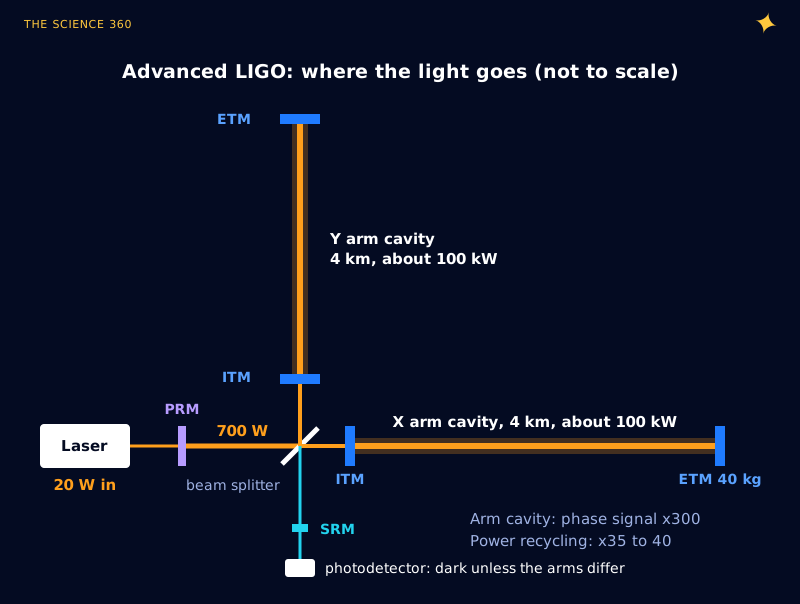
Why does more power help? The signal is a phase shift, and the precision with which you can measure a phase with light is set by counting statistics of photons. Each 1,064 nm photon carries 1.87 × 10⁻¹⁹ J, so 100 kW in an arm is about 5 × 10²³ photons per second. The relative fluctuation in a count of photons is , so quadrupling the power halves this "shot noise". The detector paper says the plan was to raise the circulating power toward 750 kW. The price is radiation pressure: 100 kW reflecting off a mirror pushes on it with , and fluctuations in that push shake the mirrors at low frequency.
The misconception: “LIGO measures 1/1,000 of a proton”
The proton comparison is everywhere, and the fraction drifts: one thousandth, one ten-thousandth, "smaller than". The problem is not that it is wrong. It is that it describes the noise, not the signal, and it hides two things that matter for understanding how detection actually works.
First, the noise in a gravitational-wave detector depends on frequency, so it is quoted as an amplitude spectral density. During the first observing run, LIGO's strain noise was about 10−23 per √Hz at 100 Hz. To turn that into a single number you need a bandwidth:
Noise in a 100 Hz wide band around 100 Hz
That is about 1/4,000 of a proton diameter. The GW150914 peak, 4 × 10⁻¹⁸ m, is about 10 times the noise in that band.
So the first event was no whisper at the edge of detectability. It stood clearly out of the noise even by eye in the filtered data, and the matched-filter search gave a signal-to-noise ratio of 24. The "thousandth of a proton" figure is closer to the noise floor than to the famous signal.
Second, LIGO does not read a length off a ruler at one instant. It finds signals by matching the data against thousands of predicted waveforms, adding up the evidence over every cycle. A signal can sit below the noise in any one cycle and still be found if it lasts long enough. That is why the shape of the waveform matters as much as its size.
What is the chirp, and why does it rise in frequency?
Two black holes in orbit radiate gravitational waves at twice the orbital frequency. Radiating costs orbital energy, so they move closer and orbit faster, which makes them radiate harder. At leading order in general relativity the frequency depends on only one combination of the masses, the chirp mass, and on the time left before merger, τ:
Leading-order (Newtonian) chirp
GW150914: 36 and 29 solar masses give at the source; times for the redshift gives about as seen at Earth, matching the paper's estimate.
Time from 150 Hz to merger: 0.0035 s. Cycles between 35 Hz and 150 Hz: 8.7.
The discovery paper describes the observed signal as rising "over 0.2 s ... in about 8 cycles from 35 to 150 Hz". A formula you can do on a calculator gets within a cycle of that. Run it the other way, as the LIGO team did on the day, and the measured frequency and its rate of change give the chirp mass directly. A chirp mass of 30 Suns orbiting at 75 Hz means objects only about 350 km apart, which nothing but black holes can manage without touching.
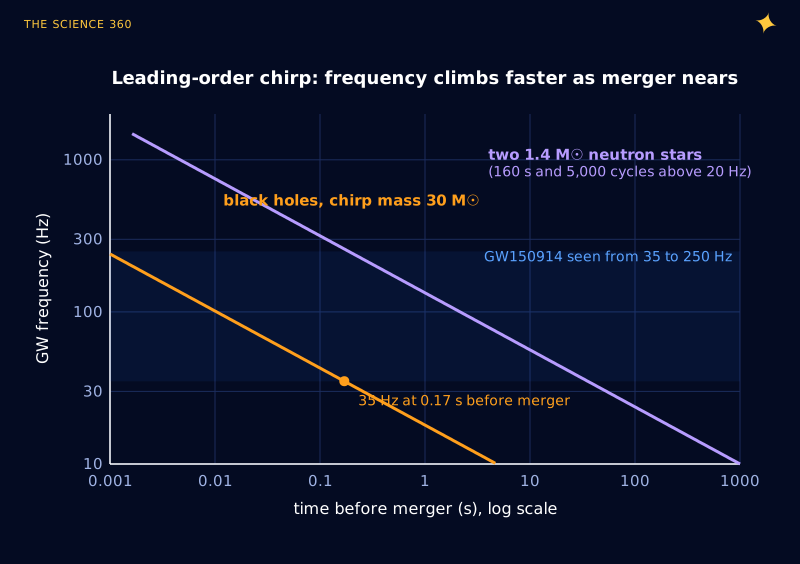
Light black holes or neutron stars chirp slowly and stay in band for a long time. Heavy black holes chirp fast and are gone in a few cycles. That difference shapes what LIGO hears: the black holes are loud but brief, the neutron stars are quiet but give thousands of cycles for the matched filter to add up.
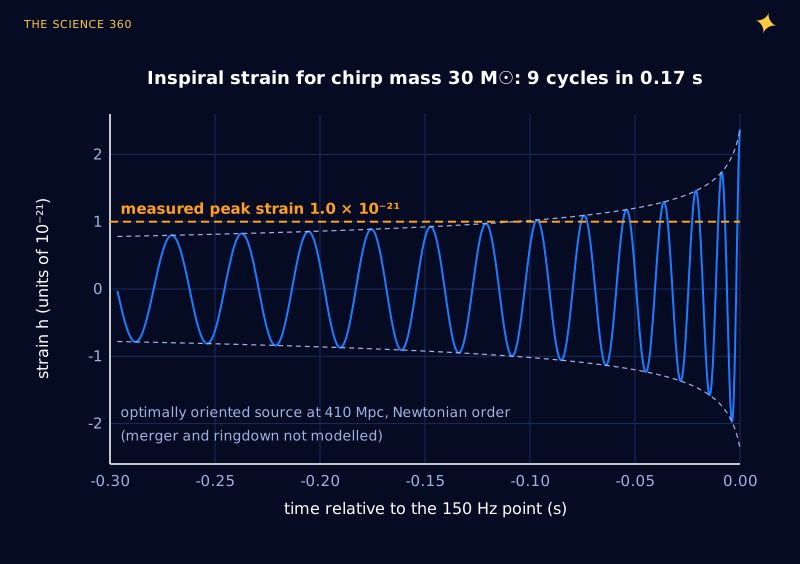
The amplitude also comes from the same formula. For an optimally placed and oriented source at luminosity distance , the leading-order strain is . At 410 Mpc and 150 Hz that gives 2.4 × 10⁻²¹. The measured peak was 1.0 × 10⁻²¹, which is what you expect once you allow for the source not sitting directly overhead with its orbit face-on.
The energy budget is the striking part. The paper puts the energy radiated as gravitational waves at about 3.0 solar masses times c2. That is 3 × 2.0 × 1030 kg × (3.0 × 108 m/s)2 ≈ 5 × 1047 J, released mostly in the last few tenths of a second (see how much energy is in one gram for the same arithmetic at a human scale). The peak luminosity was 3.6 × 1056 erg/s, or 3.6 × 1049 W. Yet by the time it reached Earth it moved mirrors by a few attometres. Spacetime is extraordinarily stiff.
If space stretches, doesn’t the laser light stretch too?
This is the question that physics forums keep returning to, and most short answers stop at "light is a clock, not a ruler". That is the right idea, so here is the version with the reasoning filled in.
Pick the description most textbooks use (the transverse-traceless gauge). In it, freely falling mirrors keep fixed coordinates, and the wave changes the metric between them. Light still moves at c locally, so the time it takes to cross an arm changes: for a slowly varying wave, the round trip in the x arm takes (2L/c)(1 + h/2) and in the y arm (2L/c)(1 − h/2).
Now ask what is being compared at the beam splitter. The phase of a returning wavefront is the phase it had when it left the laser. The laser's frequency is set by the laser itself and its stabilisation, which sits outside the arms and is not stretched by a wave passing at 100 Hz. Light that left the laser at the same moment and went down the two arms arrives back at different times, and therefore with a different phase relative to fresh light. The wavelength of the light already inside the arm does change, but that is not what the detector measures. It measures arrival times.
Travel time difference for GW150914
The 1,064 nm light oscillates once every 3.5 × 10⁻¹⁵ s, so this is a phase lag of 4.7 × 10⁻¹¹ rad, the same number as before.
Peter Saulson, a LIGO physicist, wrote an American Journal of Physics paper on exactly this objection in 1997. His summary: light is a "rubber ruler participating in the distortions", but over its trip through the arm the response builds up to the size the simple length-change picture predicts. It works.
There is a real limit hidden here. The argument assumes the wave hardly changes while the light is in the arm. With 300-fold storage, light spends milliseconds in the cavity, which is comparable to the period of a 150 Hz wave (6.7 ms). If the stretch reverses while light is still bouncing, part of the effect cancels. That is the physical reason a gravitational-wave interferometer cannot just store light forever.
Why more bounces is not always better
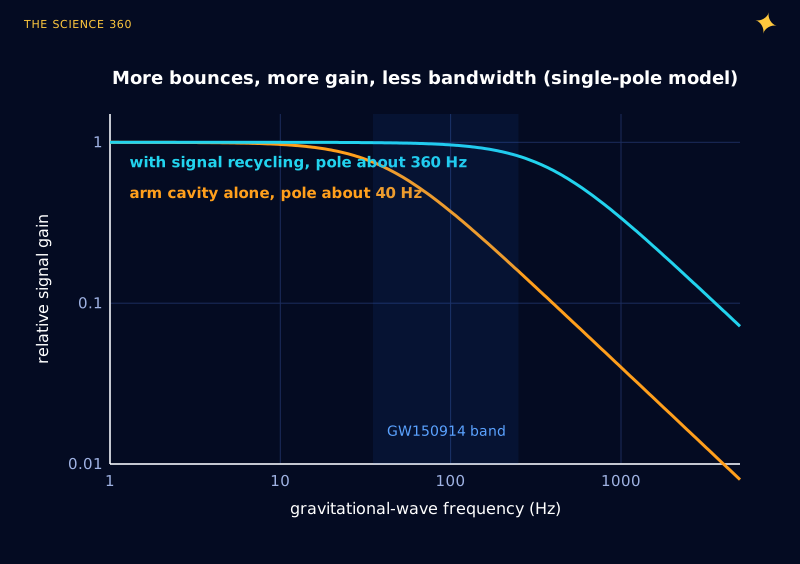
A Fabry-Pérot cavity acts like a low-pass filter for the signal. If the phase gain of 300 comes from an idealised cavity with gain 2F/π, the finesse is F ≈ 470, the light makes about 150 round trips (roughly 1,200 km of travel), it stays about 2 ms, and the response falls off above a cavity pole near 40 Hz. That would throw away most of the signal from GW150914, which lived between 35 Hz and 250 Hz.
Arm cavity, idealised (my estimate from the published factor of 300)
The fix is the third mirror, at the output port. The signal-recycling mirror forms a cavity with the arms for the signal sidebands only, and it is set up to send the signal out faster, widening the bandwidth. The detector paper gives the resulting detector bandwidth as about 335 Hz at Hanford and 390 Hz at Livingston. Figure 5 compares the two cases with a single-pole model.
Why LIGO needs two detectors 3,000 km apart
A single interferometer this sensitive feels everything: earthquakes on the other side of the planet, ocean waves hitting the coast, trucks, the 60 Hz mains and its harmonics (see why AC is 60 Hz), the thermal jiggling of mirror coatings, and the violin-like vibration modes of the suspension fibres. The detector paper lists more than 300 digital control loops keeping each instrument locked.
The defence is coincidence. Hanford and Livingston are far enough apart that a gravitational wave, travelling at c, takes up to 10 ms to cross from one to the other. A truck in Louisiana cannot make the same chirp in Washington within that window. GW150914 arrived at Livingston first and at Hanford 6.9 ms later, which, together with the relative amplitudes, placed the source in a patch of sky of about 600 square degrees. Adding Virgo in Italy and KAGRA in Japan shrinks that patch, which is how the 2017 neutron-star merger was pinned down well enough for telescopes to find its explosion.
The significance claim follows the same logic. The team shifted one detector's data in time against the other by more than 10 ms, many times over, to build an artificial background of coincidences that cannot be real. Nothing in that background looked as strong as GW150914. The false-alarm rate came out below one per 203,000 years.
FAQ
How does LIGO detect gravitational waves?
LIGO splits a laser beam into two 4 km arms at right angles, lets the light bounce in each arm about 300 times as often as a single trip, and recombines it. The output is held dark. A gravitational wave lengthens one arm and shortens the other, so the light from the two arms comes back slightly out of step and some light leaks to the photodetector.
How small a change can LIGO measure?
The first detection, GW150914, had a peak strain of 1.0 × 10⁻²¹, which changed the difference between the 4 km arms by about 4 × 10⁻¹⁸ m. That is about 1/420 of a proton's diameter. The detector noise in its most sensitive band was several times smaller still, around 4 × 10⁻¹⁹ m.
If a gravitational wave stretches space, why doesn’t it stretch the laser light too?
It does stretch light already in the arms, but LIGO is not counting wavelengths. It compares how long light takes to make the round trip in each arm. The laser keeps feeding in fresh light at a fixed frequency, the speed of light stays c, and the arm that got longer simply delivers its light later. That timing difference is the signal.
Why does LIGO need two detectors?
Local disturbances such as ground motion or a truck can shake one detector, but they cannot produce the same waveform in a detector 3,000 km away within the 10 ms that light, and gravitational waves, take to cross between the sites. GW150914 reached Livingston 6.9 ms before Hanford.
What does the gravitational wave chirp mean?
Two black holes orbiting each other radiate gravitational waves at twice their orbital frequency. As they lose energy they spiral closer and orbit faster, so the frequency and amplitude both rise until they merge. For GW150914 the signal swept from 35 Hz to 150 Hz in about 0.2 seconds, which sounds like a rising chirp when played as audio.
Related on The Science 360
Sources
- B. P. Abbott et al. (LIGO and Virgo), "Observation of Gravitational Waves from a Binary Black Hole Merger", Phys. Rev. Lett. 116, 061102 (2016): event time, 35 to 250 Hz, peak strain 1.0 × 10⁻²¹, SNR 24, masses, 3.0 M☉c2, 410 Mpc, 6.9 ms delay, chirp mass 30 M☉, 8 cycles in 0.2 s, 700 W and 100 kW: arxiv.org/abs/1602.03837
- B. P. Abbott et al., "GW150914: The Advanced LIGO Detectors in the Era of First Discoveries", Phys. Rev. Lett. 116, 131103 (2016): 4 × 10⁻¹⁸ m and "one 200th of a proton radius", 40 kg test masses, cavity gain of 300, power gain 35 to 40, 10−23/√Hz at 100 Hz, bandwidths 335 Hz and 390 Hz, 750 kW plan: arxiv.org/abs/1602.03838
- NIST, CODATA 2022 proton rms charge radius, 8.4075 × 10⁻¹⁶ m: physics.nist.gov
- P. R. Saulson, "If light waves are stretched by gravitational waves, how can we use light as a ruler to detect gravitational waves?", Am. J. Phys. 65, 501 (1997), and his AAPT talk notes: aapt.org
- Physics World, "How does LIGO detect gravitational waves?" (the "one thousandth the diameter of a proton" phrasing): physicsworld.com
Method note: chirp, cycle count and strain curves use the leading-order (quadrupole, Newtonian) inspiral formulas with and 1 Mpc = 3.086 × 10²² m. They are accurate well before merger and increasingly off near it. Cavity response curves are single-pole approximations.
Header image: NASA Goddard Space Flight Center (image GSFC_20171208_Archive_e001099), regraded for this article.