What colour is a star at a given temperature?
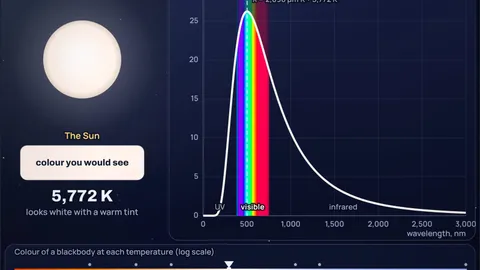
A star's colour is set by its surface temperature. Below about 3,900 K a blackbody looks orange to red, around 5,000 to 8,000 K it looks white, and above about 10,000 K it looks blue white. The Sun at 5,772 K computes to #FFF1EA, a white with a faint warm tint, even though its spectrum peaks in the green at 502 nm.
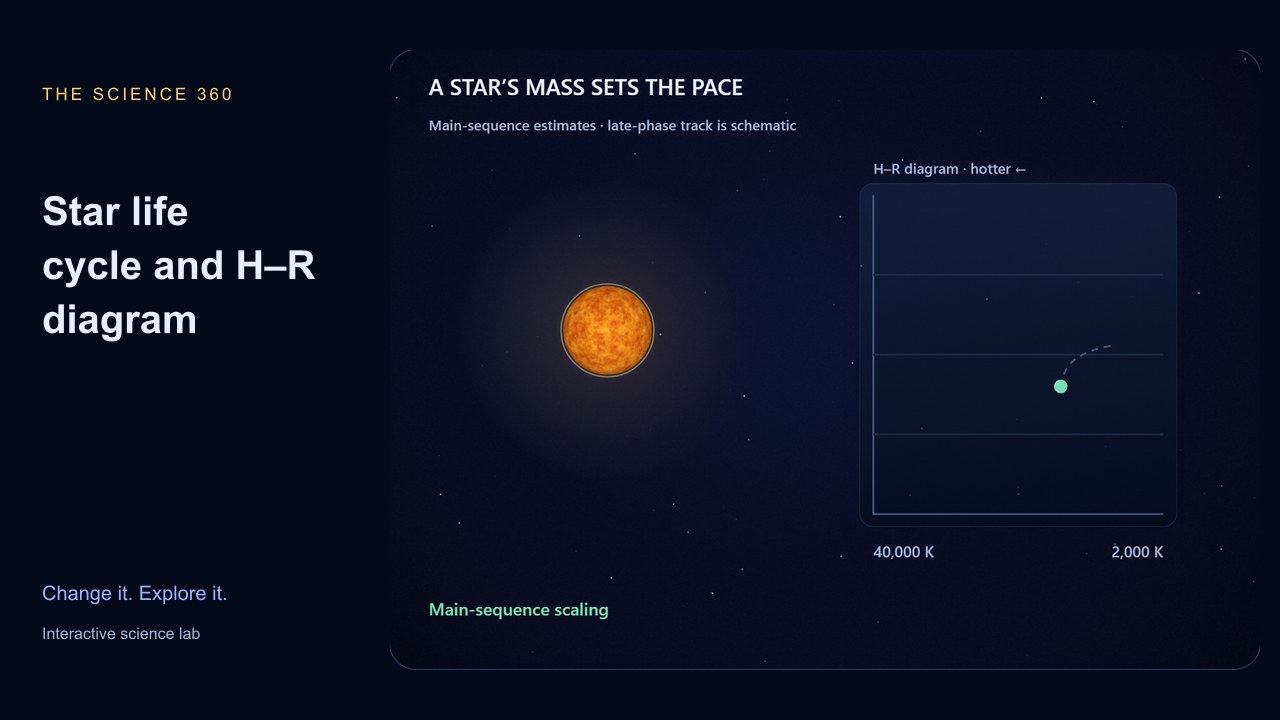
The simulation shows why. The slider sets the temperature of an ideal blackbody. The chart draws Planck's law for that temperature with the visible band filled in its real colours, and marks the peak from Wien's law, λ = 2897.8 µm·K ÷ T. The swatch is not a lookup table: it integrates the curve against the CIE 1931 colour matching functions, the standard model of human colour vision, and converts the result to a screen colour. Try a 2,700 K bulb, then Rigel, and watch the peak cross the visible band. For where those temperatures come from in a star's life, see the star life cycle simulator.
Key results from the simulation
- The peak moves as 1 ÷ T: 1,566 nm for a candle at 1,850 K, 502 nm for the Sun, 239 nm for Rigel at 12,100 K. Only stars between roughly 3,900 K and 7,600 K peak inside the visible band at all.
- The colour is not the peak colour: the Sun peaks in the green but computes to #FFF1EA, white. A curve that broad covers every cone type nearly equally.
- Hotter is far brighter per square metre: power rises as T⁴, so Rigel's surface gives off 19 times more per square metre than the Sun's (1215 MW per m² against 63 MW per m²).
- Most of the light is invisible at both ends: a 2,700 K bulb sends only 7.0% of its radiation into the visible band, the rest is infrared heat. Zeta Puppis at 40,000 K sends 97% into the ultraviolet.
- There are no green stars: as the slider moves, the swatch runs from red through orange and white to pale blue, along a single curve that never passes through green.
From a candle to a blue supergiant
Each section gives the numbers the simulation shows for one real source. Stars use published effective temperatures, lamps use their rated colour temperature. The button loads that setup.
Candle flame: 1,850 K, almost all heat
Everyday lightA candle flame glows because tiny soot particles are heated to roughly 1,850 K, and soot is close to a blackbody. At that temperature Wien's law puts the peak at 1,566 nm, deep in the infrared. Only 0.7% of the radiated power falls between 380 and 750 nm, and that sliver is weighted to the red end, so the computed colour is #FF8500, orange red.
Our eyes adapt, so a candlelit room looks warm rather than orange. A camera set to daylight balance shows the true orange. The blue base of a flame is not thermal at all: it is light from excited molecules (C₂ and CH) and the model does not include it.
2,700 K versus 6,500 K: what bulb kelvin ratings mean
LightingThe kelvin number on a lamp box is a correlated colour temperature: the blackbody whose colour the lamp matches. A "warm white" 2,700 K lamp matches a blackbody at 2,700 K, which computes to #FFAE59, a soft orange white. A "daylight" 6,500 K lamp matches #FFF9FE, almost neutral white on a standard screen, because 6,500 K is close to the D65 white point that screens are built around.
An old incandescent bulb really is a blackbody (a tungsten filament at about 2,400 to 2,700 K), which is why it wastes so much energy: at 2,700 K the peak is at 1,073 nm and 93% of the radiation is infrared. An LED lamp rated 2,700 K has a completely different spectrum (a blue chip plus a phosphor) that only looks the same colour. Use the Compare view to see how far the Sun's curve sits above both.
Betelgeuse: a red supergiant at 3,600 K
Cool starLevesque and Massey measured Betelgeuse at 3,600 K in February 2020, during its famous dimming, and found it had cooled by only about 50 K since 2004. At that temperature the peak is at 805 nm, just past the red end of the visible band, and the colour computes to #FFCB91, orange. In the sky it looks distinctly orange next to Rigel in the same constellation.
Each square metre of Betelgeuse gives off only 0.15 times what the Sun's surface does, yet the star is around 100,000 times more luminous than the Sun. That is size, not temperature: its radius is hundreds of times the Sun's. Proxima Centauri is cooler still at 2,980 K and computes to #FFB86C.
The Sun: 5,772 K, peak in the green, colour white
G2 starThe IAU's nominal effective temperature for the Sun is 5,772 K. The blackbody at that temperature peaks at 502 nm, a blue green, and 44% of its power is visible, more than for any of the other sources here except the 6,500 K lamp. The computed colour is #FFF1EA, white with a faint warm cast.
Seen from the ground the Sun looks yellow or orange because the air scatters blue light out of the direct beam, the same scattering that makes the sky blue. Our post on what colour the Sun really is covers that, and the sky colour simulator shows the effect hour by hour.
Related reading: What colour is the Sun really?
Sirius A: 9,940 K, the peak has left for the ultraviolet
Hot starSirius A is an A1 star with an effective temperature near 9,940 K (Adelman 2004; interferometry gives about 9,850 K). Its peak is at 292 nm, already in the ultraviolet, so across the visible band the curve slopes down from violet to red. The eye gets more blue than red and the colour computes to #CDDAFF, blue white.
Sirius often flashes red, green and blue near the horizon, but that is twinkling: turbulent air bends its colours by different amounts. See why stars twinkle.
Rigel and Zeta Puppis: 12,100 K to 40,000 K
Blue supergiantsRigel, the blue white foot of Orion, has an effective temperature of about 12,100 K (Przybilla and colleagues, 2010). Its peak is at 239 nm, 58% of its light is ultraviolet, and each square metre emits 19 times what the Sun's does. The colour computes to #C0D0FF.
Push the slider to the top and you reach Zeta Puppis, an O4 supergiant near 40,000 K. Its peak is at 72 nm and 97% of the radiation is ultraviolet, yet the colour, #9EB8FF, is only a little bluer than Rigel's. In the visible band every very hot curve has the same shape, the Rayleigh-Jeans tail, so star colours converge on one pale blue and never reach a deep blue.
Blackbody colour, peak and output for each source
| Source | Temperature | Peak | Visible | Per m² vs Sun | sRGB colour |
|---|---|---|---|---|---|
| Candle flame | 1,850 K | 1,566 nm | 0.7% | 0.01× | #FF8500 |
| Warm white bulb | 2,700 K | 1,073 nm | 7.0% | 0.05× | #FFAE59 |
| Proxima Centauri | 2,980 K | 972 nm | 11% | 0.07× | #FFB86C |
| Betelgeuse | 3,600 K | 805 nm | 20% | 0.15× | #FFCB91 |
| The Sun | 5,772 K | 502 nm | 44% | 1.0× | #FFF1EA |
| Daylight bulb | 6,500 K | 446 nm | 46% | 1.6× | #FFF9FE |
| Sirius A | 9,940 K | 292 nm | 39% | 8.8× | #CDDAFF |
| Rigel | 12,100 K | 239 nm | 31% | 19× | #C0D0FF |
| Zeta Puppis | 40,000 K | 72 nm | 2.5% | 2,306× | #9EB8FF |
Visible means 380 to 750 nm. Colours are the CIE 1931 2 degree observer, converted to sRGB with a D65 white, brightness normalised so the strongest channel is full. Real stars are not perfect blackbodies, so their true colours differ slightly.
How the simulation works
The curve is Planck's law, B = 2hc² ÷ λ⁵ ÷ (e^(hc/λkT) − 1), with the exact SI values of h, c and k. The peak is Wien's law, λ = 2897.8 µm·K ÷ T, and the power per square metre is the Stefan-Boltzmann law, σT⁴ with σ = 5.6704e-8 W m⁻² K⁻⁴. The share of power in the ultraviolet, visible and infrared comes from an exact series for the integral of Planck's law, not from the plot.
The colour is computed the way a colour scientist would. The spectrum is multiplied by the three CIE 1931 colour matching functions, which describe how a standard observer's cones respond, and summed every nanometre from 360 to 830 nm. That gives the XYZ tristimulus values. A standard matrix turns XYZ into linear sRGB with a D65 white point, any negative channel is lifted by adding white (very red and very blue blackbodies are slightly outside the sRGB gamut), the brightest channel is scaled to full, and the sRGB gamma curve is applied. The colour matching functions use the analytic fit of Wyman, Sloan and Shirley (2013), which matches the tabulated CIE data to within the scatter between real observers.
Brightness is normalised, so a candle and Rigel are shown equally bright: the swatch is the hue and saturation you would see if each source were dimmed or brightened to a comfortable level. The star is drawn with the site's star element and tinted to the computed colour. The Compare view plots every preset star on log axes, with the dashed Wien line joining the peaks.
What the model leaves out
- Real stars are not perfect blackbodies: absorption lines and molecular bands (titanium oxide in cool stars, the Balmer jump in A stars) bend the real spectrum away from Planck, so a measured star colour can differ a little from the blackbody colour at its effective temperature.
- Your eyes adapt: the colour shown assumes a screen with a D65 white. In a candlelit room your brain rebalances and the light looks less orange than the swatch.
- Faint stars look white: at night most stars are too dim for cone vision, so only bright ones show colour. The swatch is the colour of a bright source.
- The atmosphere: starlight near the horizon is reddened by scattering. That is not modelled here; the sky colour simulator does it.
- Non-thermal light: LEDs, fluorescent tubes and the blue base of a flame emit line or band spectra. A lamp rated 2,700 K only matches the colour of a 2,700 K blackbody, not its spectrum.
Common misconceptions
"The Sun is yellow because it peaks in yellow." It peaks near 502 nm, in the blue green, and its overall colour is white. It looks yellow from the ground because air scatters some blue out of the direct beam.
"Red means hot, blue means cold." For glowing objects it is the reverse. A blue white star is far hotter than a red one. The convention on taps is about how water feels, not how matter glows.
"There should be green stars, since some peak in green." A curve broad enough to peak in the green also covers red and blue nearly equally, so it looks white. No temperature gives a green blackbody.
Frequently asked questions
What colour is a 5,000 K or 6,000 K star?
White. A 5,000 K blackbody computes to #FFE7D0, white with a warm tint, and 6,000 K to #FFF4F1, nearly neutral. The Sun at 5,772 K sits between them.
Why are hot stars blue and cool stars red?
Wien's law: the peak of a blackbody's spectrum moves to shorter wavelengths as it gets hotter, λ = 2897.8 µm·K ÷ T. A 3,000 K star peaks in the infrared and sends more red than blue into the visible band; a 12,000 K star peaks in the ultraviolet and sends more blue than red.
What is the difference between 2,700 K and 6,500 K light bulbs?
The number is the temperature of the blackbody whose colour the lamp matches. 2,700 K is warm white, like an incandescent bulb, and 6,500 K is a cool, slightly bluish daylight white close to the D65 standard that screens use. Neither number is the lamp's actual temperature if it is an LED.
Why are there no green stars?
Because a blackbody spectrum is too broad. When it peaks in the green it also emits strongly in the red and blue, and the eye sees the mixture as white. Every blackbody colour lies on one curve, the Planckian locus, that runs from red through white to pale blue and never enters the green.
How hot is the Sun and what colour is it from space?
Its effective temperature is 5,772 K (the IAU nominal value). From space it is white: the blackbody colour at that temperature is #FFF1EA. Astronauts describe it as white, and the yellow of a ground view comes from the atmosphere.
Is blackbody radiation the same as heat radiation?
Yes. Every object above absolute zero emits thermal radiation, and a perfect absorber emits the blackbody spectrum. At room temperature the peak is near 10 µm in the infrared, which is what thermal cameras see. Above about 800 K enough reaches the visible band to see a dull red glow.
Keep learning
Why Are Stars Different Colors? Red, White and Blue Stars
Star colour is temperature: Betelgeuse at 3,600 K looks orange, the Sun at 5,772 K white, Rigel at 12,100 K blue. The physics, numbers and a chart.

What Color Is the Sun Really? White, and Here's Why
The Sun is white: a 5772 K spectrum excites all three cone types almost equally. Why it peaks near green but never looks green, and why it turns orange.
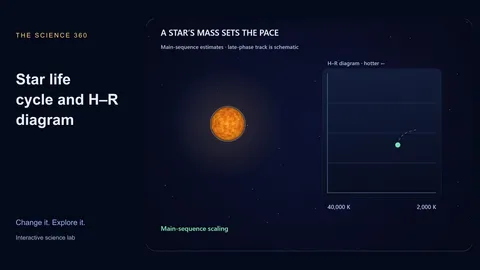
Why massive stars live fast: mass, lifetime and stellar remnants
Estimate main-sequence lifetimes from mass and luminosity, read an H–R diagram, and distinguish schematic evolution paths from detailed stellar predictions.

The Physics of Thermal Imaging
Thermal imaging is a fascinating technology that allows us to visualize and analyze the heat emitted by objects and living beings.