How does motion shift the fingerprint of hydrogen?
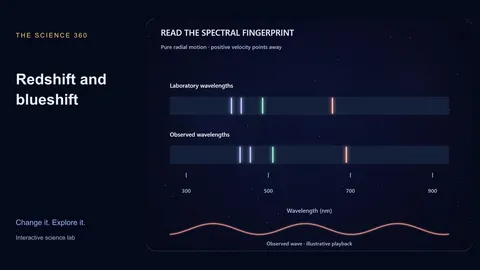
A receding source shifts its spectral features to longer wavelengths; an approaching source shifts them to shorter wavelengths. Astronomers compare the observed pattern with known laboratory wavelengths.
This lab uses hydrogen Balmer lines and a purely radial special-relativistic Doppler shift. In mystery mode the observed spectrum stays fixed while your proposed velocity changes, letting you infer a hidden motion from a measurement.
Read the companion article for a worked investigation, or continue with refraction snell law.
What to look for
- At zero radial velocity the observed and rest wavelengths coincide.
- All lines share the same fractional wavelength shift, not the same nanometre shift.
- Positive z means redshift; negative z means blueshift in this convention.
Experiments to try
Load a complete preset, predict what will change, then adjust one control and compare the live measurements.
Receding source
Guided experimentEvery wavelength is multiplied by the same factor, about 1.0513 at 0.05c. A line initially at 656.28 nm moves to roughly 689.96 nm. The line pattern stays recognizable even though all its features move.
Approaching source
Guided experimentNegative radial velocity shifts the spectrum toward shorter wavelengths. The formula is relativistic, so equally large approach and recession velocities give reciprocal wavelength factors, rather than exactly symmetric wavelength changes.
Solve a spectrum
Guided experimentThe lower spectrum is generated at a fixed hidden velocity. Move your velocity estimate until the dashed prediction lines match the observed lines. The numerical mismatch reports how close the patterns are; solve from the wavelength ratio rather than guessing a colour.
Compare the cases
| Radial velocity | Wavelength factor | Shift |
|---|---|---|
| −0.05c | 0.9512 | Blue |
| 0 | 1 | None |
| +0.05c | 1.0513 | Red |
Rounded values and classifications refer to the model and assumptions on this page.
How the model works
The model multiplies 410.17, 434.05, 486.13 and 656.28 nm by the longitudinal relativistic Doppler factor. Spectral-line markers are schematic rather than a temperature- and pressure-dependent stellar spectrum.
In mystery mode a deterministic synthetic observation is drawn separately from the slider prediction. The match score is the H-alpha wavelength difference, so a correct velocity aligns the whole pattern.
What the model leaves out
- Pure radial relative motion only; no transverse or gravitational Doppler contribution.
- No cosmological expansion model, line blending, noise or instrument calibration.
- Spectrum colours are illustrations; the wavelength ruler and numeric readings are the measurements.
Common misconceptions
Cosmological redshift is not simply a nearby star’s Doppler velocity. This lab does not turn the redshift of a distant galaxy into its distance or model expansion of space.
Frequently asked questions
Why use several spectral lines?
A repeating pattern helps identify the element and avoids mistaking an unrelated line for the one being measured. Here every Balmer line must match the same factor.
Can a line leave the visible range?
Yes. A sufficiently large wavelength factor can move a visible feature into infrared or ultraviolet. The ruler extends beyond the visible band.
Keep learning
Reading motion in starlight: redshift, blueshift and spectral fingerprints
Measure a hydrogen line’s Doppler shift, distinguish fractional and absolute wavelength changes, and solve a synthetic mystery spectrum.