Why planets seem to move backward: retrograde motion explained
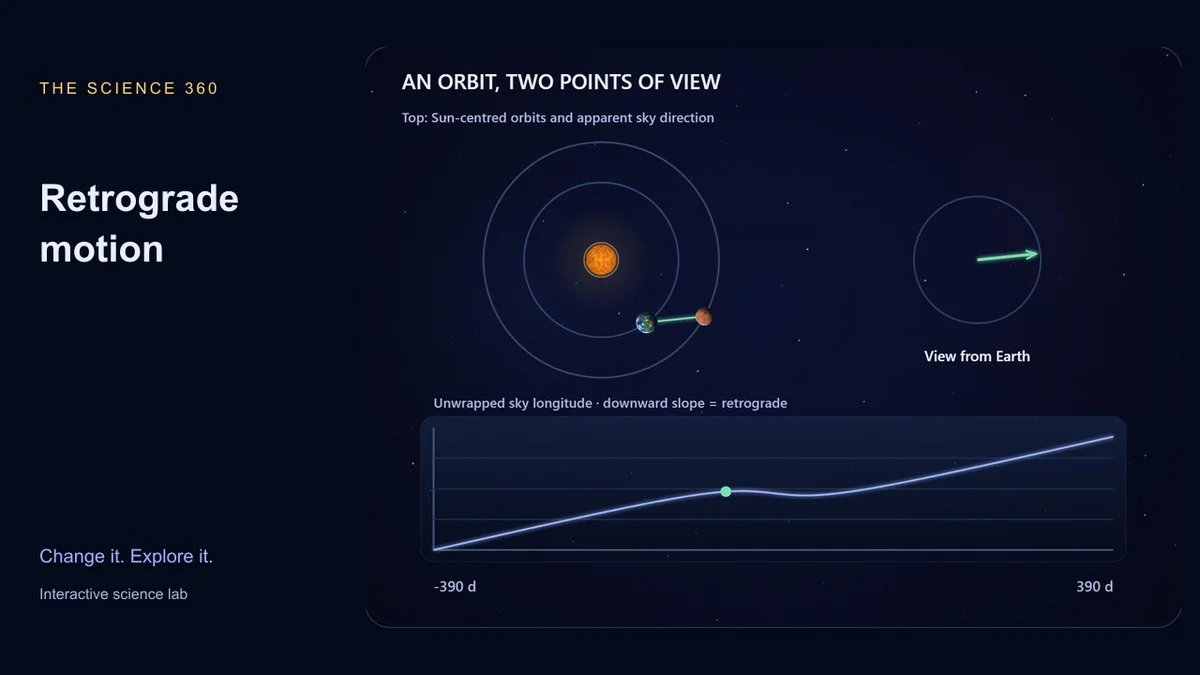
Mars does not reverse its orbit when it moves backward across our sky. Earth is moving too. The apparent reversal comes from how the line joining Earth to the planet turns as both worlds travel around the Sun.
The retrograde motion simulator shows the heliocentric geometry and the apparent sky direction together. Its lower chart is especially useful: a downward slope means decreasing apparent longitude, even while both orbital angles keep increasing.
Watch the sightline, not just the planet
Start with the Mars preset and press Play. Earth’s smaller orbit carries it around more quickly. As Earth overtakes Mars, our line of sight swings backward against distant stars. Later the apparent direction returns to its usual forward trend.
In the model, day zero is a chosen alignment. It is not today’s sky, and changing the starting offset does not select a calendar date. This distinction matters if you want to use the visualization for an observing plan.
The position calculation is straightforward. Subtract Earth’s x and y coordinates from the planet’s, then take the angle of the resulting vector. The derivative of that angle tells us whether the apparent motion is forward or backward.
How long until the geometry repeats?
The synodic period is the interval between repeated relative alignments. For orbital periods E and P:
1/S = |1/P − 1/E|
In this circular model, Earth takes about 365.256 days and Mars about 687 days. The resulting synodic period is roughly 780 days. That is much longer than either an individual retrograde interval or a month.
| Planet | Approximate synodic period in the model |
|---|---|
| Mercury | 116 days |
| Venus | 584 days |
| Mars | 780 days |
Mercury uses the same idea with different geometry
Mercury is inside Earth’s orbit and moves faster around the Sun. It overtakes us rather than waiting for us to overtake it. Its apparent reversal happens near the geometry in which it passes between Earth and the Sun.
Switch from Mars to Mercury and compare the sign of the angular-rate reading near alignment. The coordinate subtraction is unchanged; which planet does the overtaking has changed. Venus offers another inner-planet example with a longer repeat cycle.
What the chart does and does not show
The graph unwraps longitude across 360 degrees. Without unwrapping, an ordinary boundary crossing could look like a huge backward jump. Here a reversal is a genuine change in the slope of a continuous angle curve.
Real planets also have inclined, eccentric orbits. Their sky paths can make loops with a north–south component. This lab uses coplanar circles and plots longitude only, so it illustrates the cause without predicting exact retrograde dates or visibility.
Pause at the beginning and end of a reversal and save both setups. Explain how the same forward orbital motion produces opposite apparent angular rates. Then compare with the Kepler orbit simulator.