Why does a planet sometimes seem to move backward?
Retrograde motion is a reversal of a planet’s apparent direction against distant stars, caused by the changing viewing geometry from moving Earth. The planet need not reverse its orbit.
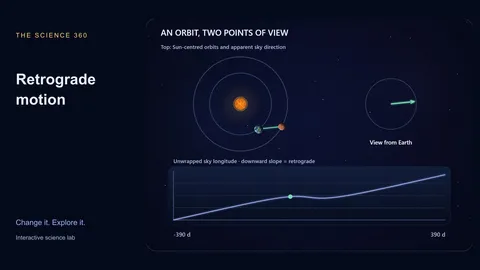
The left panel shows circular orbits from above. The lower chart unwraps the apparent ecliptic longitude into a continuous curve. A downward slope means retrograde motion. Scrub playback to compare the exact same moment in both views.
Read the companion article for a worked investigation, or continue with kepler orbits.
What to look for
- Earth overtakes Mars; Mercury and Venus overtake Earth.
- The sign of the apparent angular rate determines prograde or retrograde motion.
- For circular periods P and E, the synodic period is 1 / |1/P − 1/E|.
Experiments to try
Load a complete preset, predict what will change, then adjust one control and compare the live measurements.
Overtake Mars
Guided experimentWatch Earth overtake the outer planet. The orbit panel continues forward while the apparent longitude curve briefly slopes downward. Day zero is an idealized same-longitude alignment, not a calendar prediction.
Mercury passes Earth
Guided experimentMercury is on the inner, faster orbit. Retrograde occurs near the alignment where it passes between Earth and the Sun. The same relative-position calculation works even though the overtaking body is different.
Venus comparison
Guided experimentVenus takes longer than Mercury to repeat its viewing geometry with Earth. Change the planet while keeping an eye on the synodic period readout and the sign of the angular rate.
Compare the cases
| Planet | Orbit size | Approximate synodic period |
|---|---|---|
| Mercury | 0.387 AU | 116 days |
| Venus | 0.723 AU | 584 days |
| Mars | 1.524 AU | 780 days |
Rounded values and classifications refer to the model and assumptions on this page.
How the model works
Each planet follows a circular orbit with a period from Kepler’s third law: P = 365.256 a^(3/2) days when a is in astronomical units. Earth’s position is subtracted from the planet’s position to obtain the line of sight.
The displayed angular rate is the analytic derivative of that line-of-sight angle, rather than a finite difference across an angle wrap. The longitude chart is unwrapped so crossing 360° does not create a false reversal.
What the model leaves out
- Circular, coplanar orbits; no orbital inclination or real ephemerides.
- The chart shows ecliptic longitude, not a two-dimensional star-map loop.
- No visibility, daylight, horizon or observing-date predictions.
Common misconceptions
Mercury retrograde describes apparent sky motion. This simulation makes no claims about effects on people, technology or events.
Frequently asked questions
Does Mars actually stop orbiting?
No. Its heliocentric orbital angle increases throughout this model. Only the direction of the line of sight from Earth temporarily reverses.
Can this predict the next retrograde date?
No. The day offsets are model time from a chosen alignment. Real dates require orbital elements and a planetary ephemeris.
Keep learning
Why planets seem to move backward: retrograde motion explained
Use Earth’s moving viewpoint to explain Mars, Mercury and Venus retrograde motion, with a worked synodic-period example.