Why Is Ice Slippery? Not Pressure Melting, Here's the Math
Push a skate blade into rink ice as hard as a 70 kg person can and you lower the ice's melting point by about one degree Celsius. The rink is at about −7 °C. On a cold day in Canada the pond is at −20 °C, and below −22 °C, a number almost nobody quotes, there is no pressure at all that will melt ordinary ice. Squeeze harder and it turns into a different, denser kind of ice instead. Yet people skate happily at −30 °C.
So the explanation most of us were taught at school, "the pressure of the blade melts the ice and you slide on water", cannot be the main story. Most of the top results for this question now say so, which is progress. What they rarely do is show the numbers, and several still repeat a flawed version of the calculation that makes pressure look even weaker than it is. Below we work it out properly, then look at what the measurements say ice friction actually depends on.
Does pressure melt ice under a skate? The worked calculation
Ice is one of the few solids that is less dense than its liquid: 916.7 kg/m3 against 999.8 kg/m3 for water at 0 °C. That is why squeezing ice favours melting, and why the idea has some physics behind it. The size of the effect comes from the Clausius-Clapeyron equation, , where Δv is the change in volume per kilogram on melting and L is the latent heat.
Melting point slope at 0 °C
L = 333,550 J/kg, T = 273.15 K
That is −0.074 °C per megapascal, or −0.0075 °C per atmosphere.
Check: the IAPWS 2011 melting-curve equation gives −0.0743 °C/MPa at the triple point. They agree.
Now the pressure. Here is where a common version of the argument goes wrong. You will often see: a 70 kg skater on two blades about 3 mm wide and 30 cm long presses with about 50 psi (0.35 MPa), which lowers the melting point by 0.03 °C, so pressure melting is ruled out. The conclusion is right but the arithmetic is not, because a skate does not touch the ice along its whole length. Blades are curved (rockered) and usually tilted on an edge, so the contact patch is much smaller.
Contact pressure under one blade, 70 kg skater
Whole-blade area, 2 blades × 3.2 mm × 30 cm:
Realistic contact, 1 mm × 5 cm on one blade (own estimate):
John Joly's 1886 estimate for a blade edge:
That is on the full melting curve (Joly's linear formula gave −3.5 °C).
So pressure is not negligible. A few degrees of melting point depression is real, and near 0 °C it may help. But look at what the curve demands for colder ice.
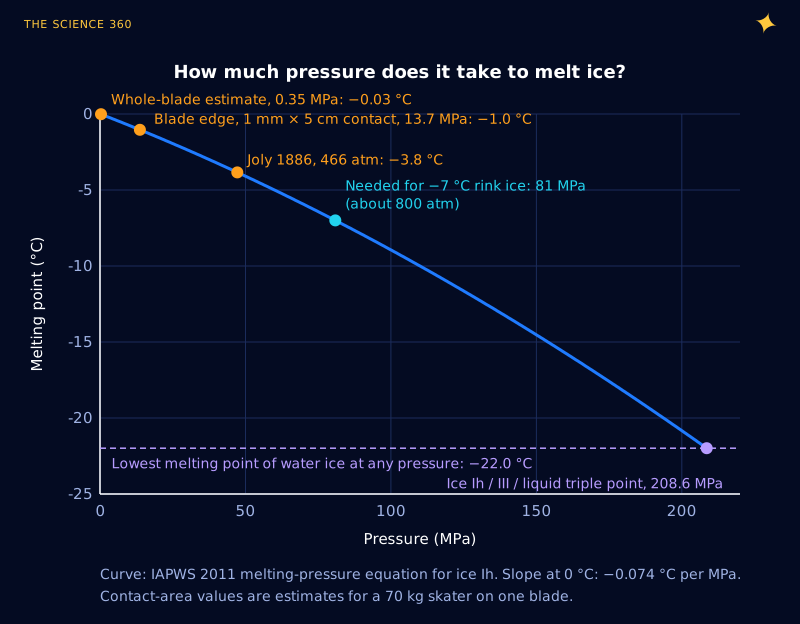
Pressure needed to melt ice at various temperatures (IAPWS 2011)
Below −21.985 °C: not possible. At 208.6 MPa ice Ih, ice III and liquid water coexist, and the melting curve of ice III then rises again with pressure.
Could a skate edge reach 81 MPa? Not in a sustained way, because ice is not infinitely hard. When you push a hard indenter into ice, the ice yields and flows before the pressure gets that high, especially near its melting point, where it is softest. The contact simply spreads until the pressure falls to what the ice can bear. And at −25 °C or −30 °C, where skating still works, the phase diagram forbids pressure melting completely. This argument, made carefully by the glaciologist Samuel Colbeck in a series of papers from 1988 to 1997, is what finally retired pressure melting as the main explanation.
Is it frictional heating instead?
In 1939 Frank Bowden and T. P. Hughes proposed the next candidate. Working in an ice cave at the Jungfraujoch research station in Switzerland, they found that metal skis had more friction than wooden ones. Pressure melting does not care what the ski is made of, but frictional heating does: a metal ski conducts the heat away from the contact, so less ice melts. Friction melting became the textbook alternative, and at speed it is a real effect. How much energy is there to work with?
Frictional heat under a speed skate (own estimate)
Energy per metre travelled: 6.9 J. Spread over a 1.1 mm wide track:
Energy to warm ice from −7 °C and melt it:
Maximum meltwater film if no heat leaked:
Twenty micrometres is an upper bound; much of the heat flows into the cold ice and the steel instead of melting anything, and the real film is probably far thinner. Notice the more important point, though. That energy per square metre does not depend on speed. And when you are standing still, it is zero. Yet ice is slippery when you step onto it from a standstill, which is exactly when people fall over. Frictional heating may make fast sliding easier, but it cannot be why ice is slippery to begin with.
The surface of ice is already different
The idea that finally fits goes back to Michael Faraday. He noticed that two pieces of ice touching each other freeze together into one, and argued in the 1850s that the surface of ice carries a thin liquid film of its own. Lord Kelvin's brother James Thomson thought pressure explained it; Faraday answered with experiments in which the ice was only lightly loaded, hung on threads from lead weights in a bath of water at 0 °C. For more than a century the "premelted" layer was hard to detect directly, but modern tools have found it: nuclear magnetic resonance, glancing-angle X-ray scattering, proton backscattering, atomic force microscopy and sum-frequency spectroscopy.
The physical reason is simple to state. A water molecule in bulk ice makes four hydrogen bonds with its neighbours. At the surface, there are no neighbours above, so molecules are held by fewer bonds and jiggle more. Rosenberg's review in Physics Today summarises NMR results for the surface between −20 °C and 0 °C: the surface molecules rotate about 100,000 times faster than molecules in bulk ice and about one twenty-fifth as fast as in liquid water. Not solid, not quite liquid.
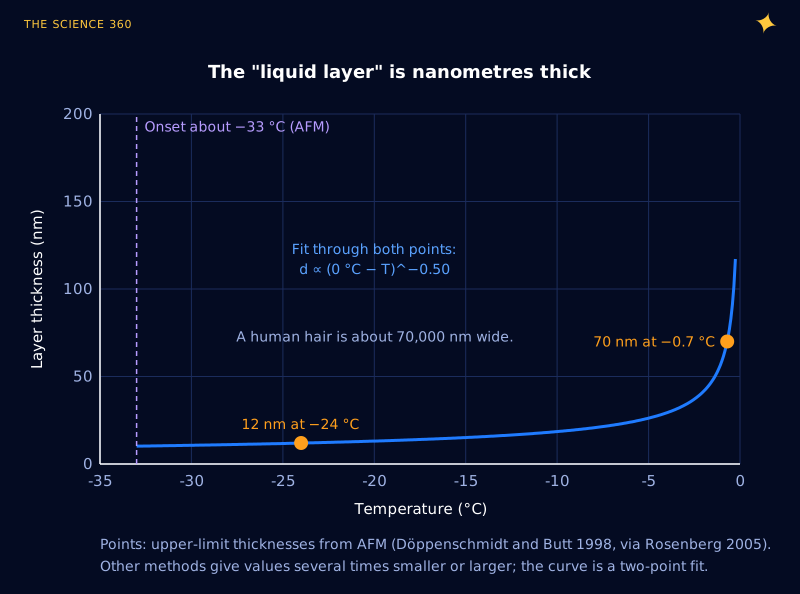
Even the generous numbers are tiny. At −7 °C the fit gives about 22 nm, a few dozen molecules deep and about three thousand times thinner than a human hair. It is not a puddle you could see or feel. And here the popular "quasi-liquid layer" story gets a bit too neat: if a liquid film were the whole explanation, ice should be most slippery right at 0 °C, where the film is thickest. It is not.
What temperature is ice most slippery?
In 2018 Bart Weber, Daniel Bonn, Mischa Bonn and colleagues at the University of Amsterdam and the Max Planck Institute for Polymer Research slid a polished 2.4 mm steel sphere over ice on a rheometer, measuring friction from −100 °C to 0 °C and at speeds from a micrometre to 10 centimetres per second. Three findings matter here.
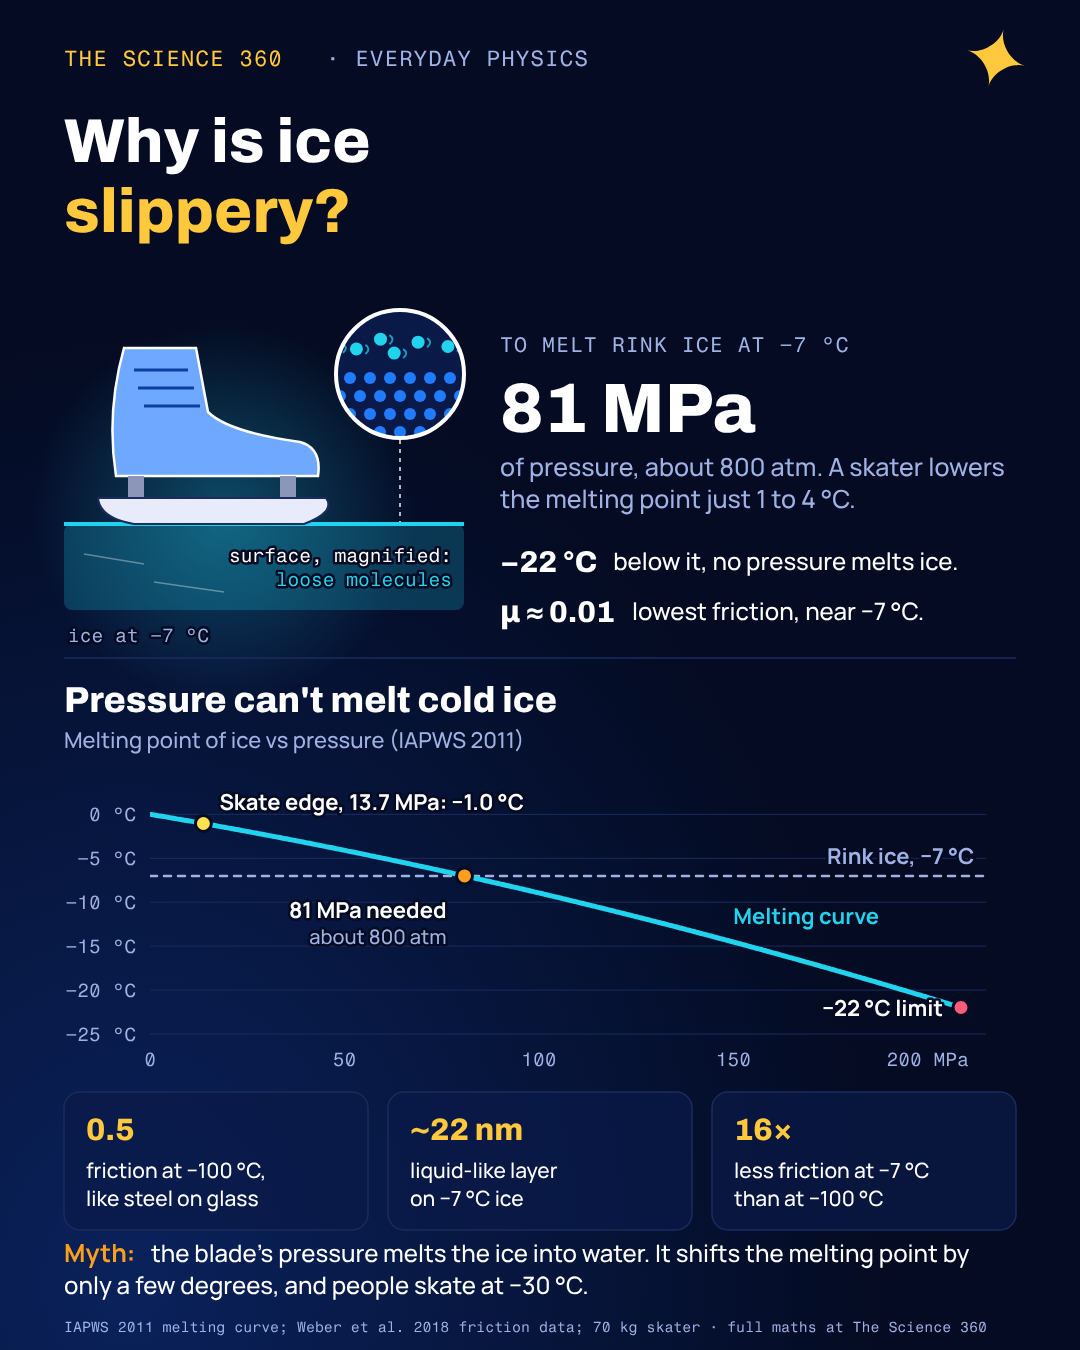
First, cold ice is not slippery at all. At −100 °C the friction coefficient (friction force divided by load) was 0.5, the same as the steel sphere on glass. Second, warming the ice made friction fall by more than an order of magnitude, reaching values as low as 0.01 around −7 °C, comparable to real ice skating. The fall followed an Arrhenius law with an activation energy of about 11.5 kJ/mol, and molecular dynamics simulations of the ice surface gave a very similar activation energy for the sideways mobility of surface molecules. Third, above −7 °C friction rose again.
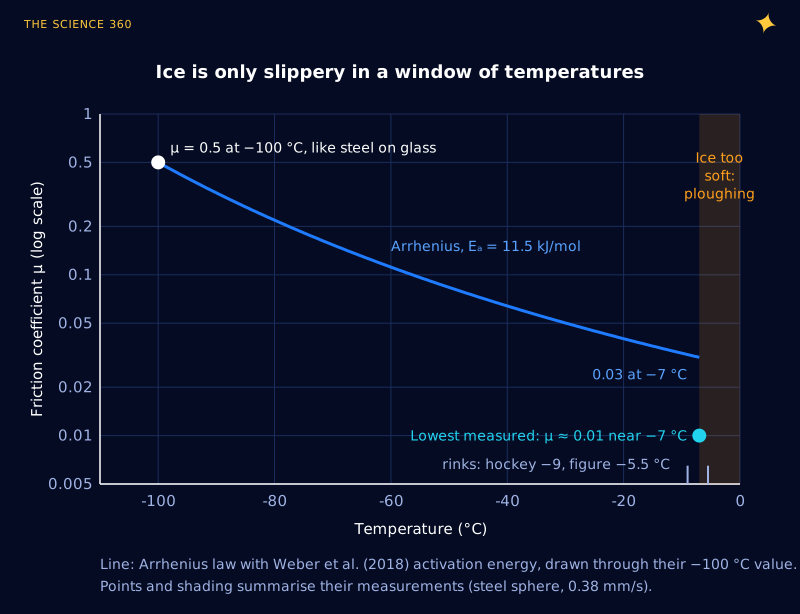
How much the surface loosens up, Arrhenius factor
with Ea = 11,500 J/mol, R = 8.314 J mol−1 K−1. From −100 °C (173.15 K) to −7 °C (266.15 K):
So friction should drop about 16-fold, from 0.5 to about 0.03, from surface mobility alone.
The rise above −7 °C is not about the surface at all. Close to its melting point ice becomes soft, the sphere sinks in and ploughs a visible track, and pushing ice out of the way costs force. Below −7 °C the contact in their experiments was purely elastic and left no mark. The optimum is the crossover between a surface that is not yet mobile enough and a bulk that is getting too soft.
Their picture of the surface is specific: in simulations, some surface molecules hold three hydrogen bonds and are stuck to the crystal, while others hold only two and wander over the surface, in the authors' words in a rolling motion. As temperature rises, more molecules convert to the loosely held kind. Sliding then works like moving over a layer of molecular marbles. They also found that friction did not depend on sliding speed in the slippery regime, which is evidence that frictional heating was not doing the work in their experiment.
Practical rinks agree. Physics Today's review gives about −9 °C as the preferred temperature for hockey, where players want hard, fast ice, and about −5.5 °C for figure skating, where softer ice cushions landings. Speed skating rinks, according to the Amsterdam group, are kept at about −7 °C, the temperature their experiment found to be fastest.
Is the question settled now?
Not completely, and any page that tells you "scientists finally solved it" in one sentence is overselling. The serious candidates are not exclusive, and each dominates in different conditions:
- Surface mobility and premelting explain why ice is slippery from a standstill, and why slipperiness fades in deep cold.
- Ploughing and softening explain why ice gets grabby again near 0 °C, and why a groomed rink is kept a few degrees below freezing.
- Frictional heating probably thickens the lubricating film at high speed, as for a speed skater or a bobsleigh, and explains Bowden and Hughes's ski results.
- Pressure melting contributes a degree or so near 0 °C and nothing below −22 °C.
In August 2025 Achraf Atila, Sergey Sukhomlinov and Martin Müser at Saarland University added another angle in Physical Review Letters. Their simulations suggest that the interaction between the electric dipoles of water molecules and those of the sliding surface disorders the ice at the contact, turning a thin layer amorphous and eventually liquid-like, and that neither pressure nor friction plays a particularly significant part in forming it. They report that a film forms even near absolute zero, though it is far more viscous than honey and would be useless for skiing. This is a simulation result and will need experiments to test, but it fits the general direction of the last two decades: the slipperiness comes from what happens to the first few molecular layers of ice in contact with something, not from bulk melting.
Why is ice so slippery when it is wet?
Ice near 0 °C with standing water on top behaves differently again. A thick water film is a lubricant, but it also sticks: a flat shoe sole on wet ice is held by capillary suction and viscous drag, and a fast object can hydroplane. This is why the most dangerous ice for walking is often the stuff right at the melting point, or with a sheet of meltwater on it, while very cold, dry ice under a squeaking boot feels almost sandy. Antarctic travellers knew this well. Edward Wilson, on Scott's last expedition, described the snow at about −46 °C as like sand.
FAQ
Is ice slippery because pressure melts it?
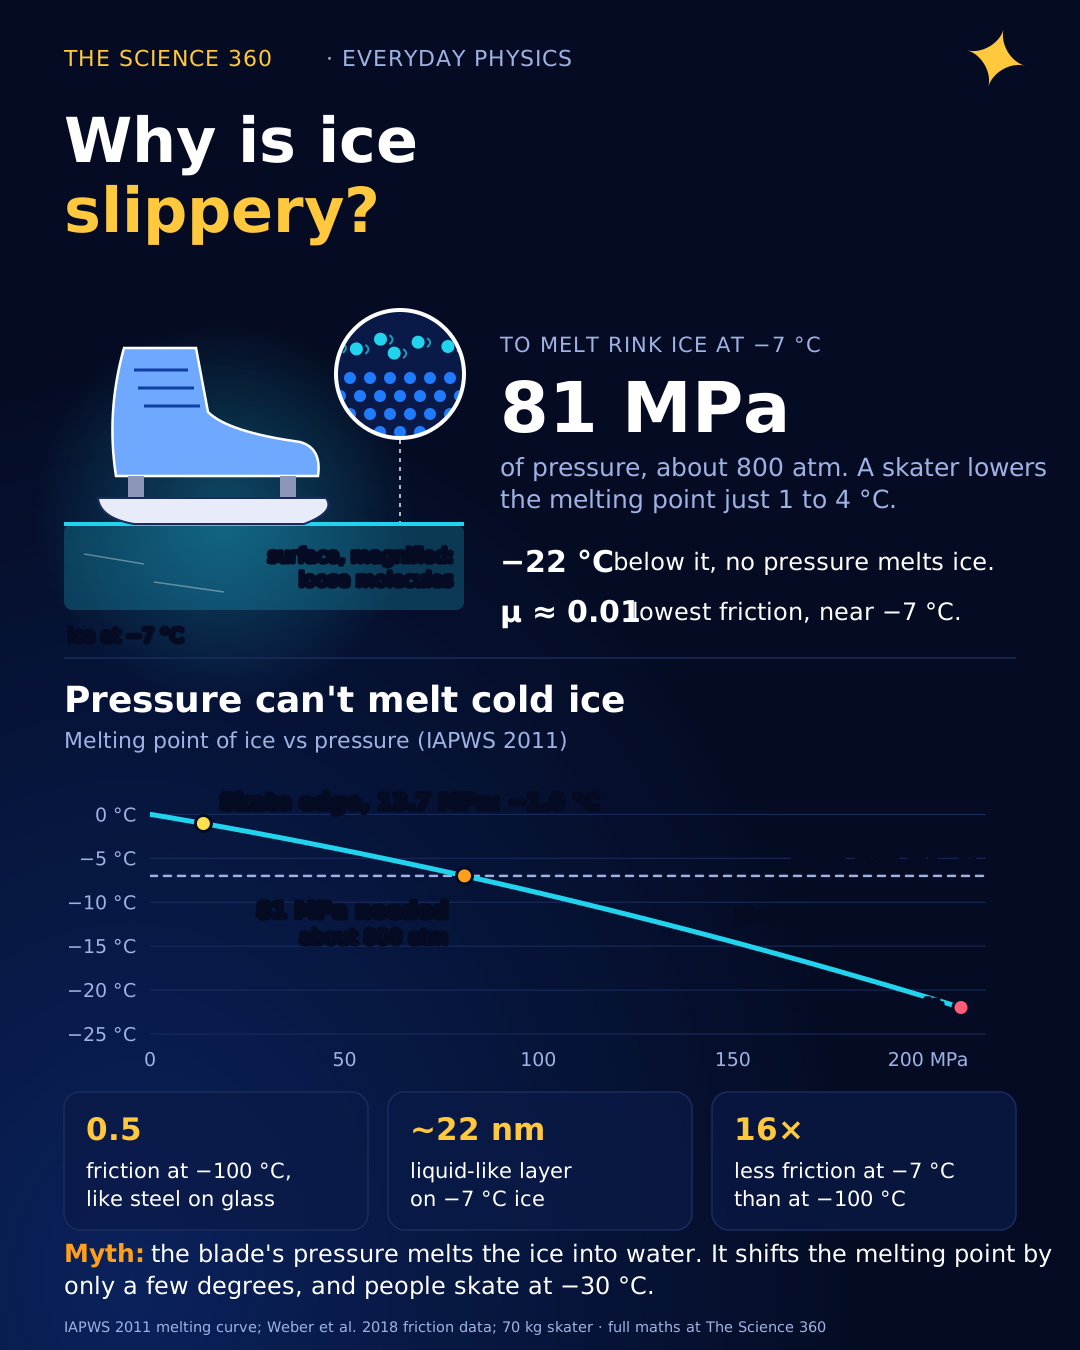
Mostly no. Pressure lowers ice's melting point by only about 0.074 °C per megapascal. A 70 kg skater on a blade edge exerts roughly 10 to 50 MPa, enough to lower the melting point by 1 to 4 °C. Rink ice at −7 °C would need about 81 MPa, and below −22 °C no pressure at all can melt ordinary ice, yet skating still works at −30 °C.
Why is ice slippery even when you are standing still?
Because the slipperiness belongs to the ice surface itself, not to melting caused by your weight or motion. The top layer of water molecules is held by fewer hydrogen bonds than the bulk, so the molecules are mobile and can roll and shear easily. Above about −30 °C this disordered surface becomes a liquid-like film nanometres thick.
What temperature is ice most slippery?
Around −7 °C for steel sliding on ice. A 2018 study by Weber, Bonn and colleagues measured a friction coefficient as low as 0.01 near −7 °C. Colder ice has less mobile surface molecules and more friction; warmer ice becomes soft enough that a blade ploughs into it. Hockey rinks are kept near −9 °C and figure skating rinks near −5.5 °C.
Is ice slippery at very low temperatures?
Much less. The same 2018 measurements found a friction coefficient of 0.5 at −100 °C, about the same as steel on glass. Polar explorers reported snow that felt like sand at around −46 °C. Simulations published in 2025 suggest a very thin, very viscous interface film can form even near absolute zero, but it would not make good skating.
Does friction melt the ice under a skate?
It can contribute at speed. With a friction coefficient of 0.01, a 70 kg skater on a 1.1 mm blade dissipates about 6 kJ per square metre of ice the blade passes over, enough in principle to melt a film roughly 20 micrometres thick if none of the heat leaked away. Most of it does leak into the ice and blade, and friction heating cannot explain why ice is slippery when you are not moving.
Related on The Science 360
Sources
- B. Weber, Y. Nagata, S. Ketzetzi, F. Tang, W. J. Smit, H. J. Bakker, E. H. G. Backus, M. Bonn and D. Bonn, "Molecular Insight into the Slipperiness of Ice", J. Phys. Chem. Lett. 9, 2838 (2018), open access copy: ir.amolf.nl (PDF)
- R. Rosenberg, "Why Is Ice Slippery?", Physics Today 58(12), 50 (2005): Joly 466 atm, Bowden and Hughes, Colbeck, rink temperatures, NMR and AFM results: aip.brightspotcdn.com (PDF)
- IAPWS, "Revised Release on the Pressure along the Melting and Sublimation Curves of Ordinary Water Substance" (2011), melting-pressure equation for ice Ih and the Ih/III/liquid triple point at 251.165 K, 208.566 MPa: iapws.org
- Saarland University press release, "Why we slip on ice: Physicists challenge centuries-old assumptions" (29 August 2025), on A. Atila, S. V. Sukhomlinov and M. H. Müser, "Cold Self-Lubrication of Sliding Ice", Phys. Rev. Lett. 135, 066204 (2025): uni-saarland.de
- Phys.org, "The slipperiness of ice explained" (May 2018), press summary of the Weber et al. study: phys.org
Method note: the melting curve is the IAPWS 2011 equation evaluated directly. Contact pressures and the frictional melt estimate use round-number blade geometry and are my own estimates. The friction curve is an Arrhenius law using the published activation energy, not a fit to the raw data.
Header image: NASA (image GSFC_20171208_Archive_e001294), regraded for this article.