We changed NASA’s temperature baseline. The warming trend did not move
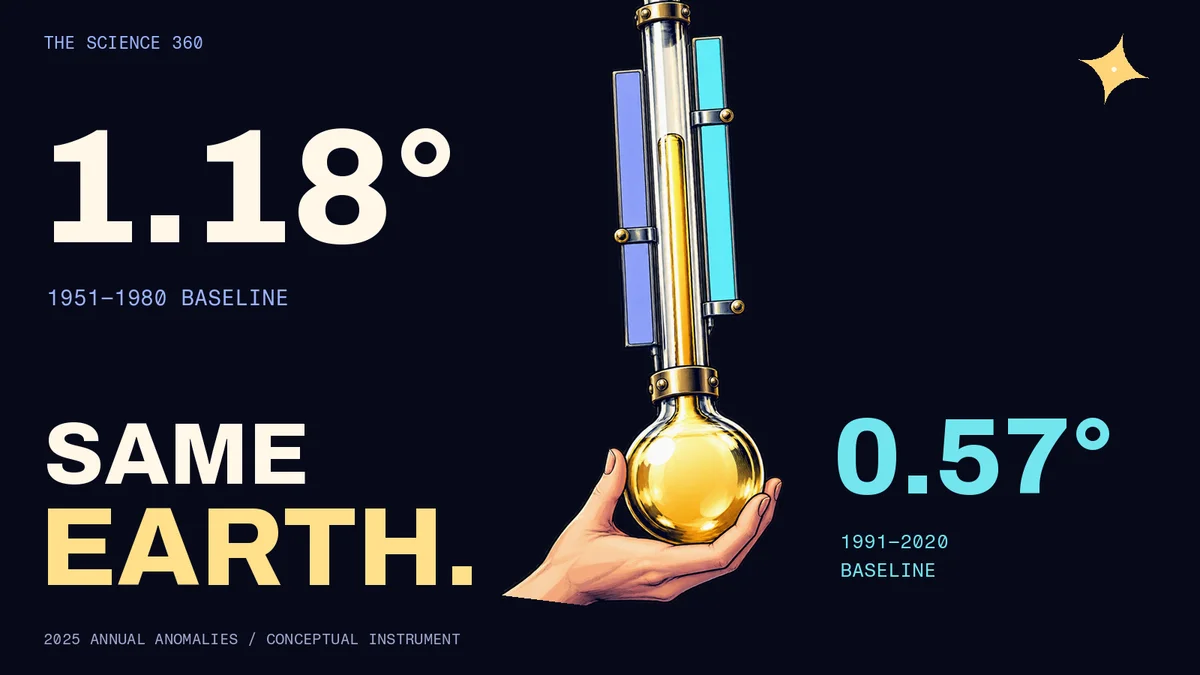
The same year’s global temperature can be 1.18°C above one reference period and 0.57°C above another. That does not mean Earth cooled between calculations. It means we moved the zero on the scale.
We downloaded NASA’s annual global temperature-anomaly table on 26 October 2026 and recalculated it against three 30-year reference periods. For the 1970–2025 interval, all three versions produced the same descriptive warming slope: about 0.201°C per decade. The changes in the headline anomaly were substantial; the slope change was zero to the numerical tolerance of our calculation.
This is a reproducible check of what changing a baseline does. It is not a new reconstruction of Earth’s temperature, a forecast for the rest of 2026, or an attempt to replace the published NASA analysis.
First, ask what the number is above
An anomaly is a departure from a reference average. NASA’s GISTEMP FAQ specifies 1951–1980 for its standard surface-temperature analysis and explains why a fixed reference helps maintain a consistent long-term record.
A warmer, more recent reference produces a smaller positive anomaly for the same warm year. A colder reference produces a larger one. Both statements can describe the same series when their labels are clear.
Reference periods serve different purposes. The Met Office’s explanation of updated climate normals shows how recent 30-year averages help describe present-day conditions. That does not require scientists to discard older fixed references used for long-term change. Its UK numerical results are not global values; our calculation below uses only NASA’s global series.
Current climate reports make these distinctions practical. NOAA’s September 2026 report states its global departure relative to a 20th-century average. That is a monthly value from a different analysis, so it should not be placed beside a NASA annual value and treated as a direct disagreement. Match the dataset, time window, coverage and reference before comparing numbers.
What we downloaded, and what we left out
Our input is the NASA GISS global land–ocean CSV, a snapshot retrieved on 26 October 2026. We used its J-D column: January–December annual anomalies in degrees Celsius. The snapshot contains 146 complete annual values, from 1880 through 2025.
The 2026 row contains monthly entries through September, but its annual field is marked missing. We excluded it. Averaging the available months and silently calling that a completed annual observation would answer a different question.
The source is already a processed estimate. We did not average raw weather stations, reconstruct ocean coverage, or rerun NASA’s homogenization and spatial methods. The GISTEMP project documentation describes that upstream work and notes that late observations and corrections can revise earlier values. The archived input lets readers reproduce this particular calculation even if the current download changes.
Three zero points, one set of annual observations
For each chosen reference period, the script averages its 30 annual anomaly values and subtracts that mean from every year. All three periods use exactly the same input series and units.
| Reference period | Mean of its annual values in the downloaded table | Rebased 2025 anomaly |
|---|---|---|
| 1951–1980 | approximately 0.000°C | +1.18°C |
| 1981–2010 | +0.422°C | +0.76°C |
| 1991–2020 | +0.611°C | +0.57°C |
The small nonzero mean for the original reference is about 0.00033°C. The downloaded annual values are rounded to hundredths of a degree, so averaging those rounded entries need not produce exactly zero. Our recentering removes that residual; it does not justify treating the measurements as accurate to five decimal places.

Source: NASA GISS/GISTEMP v4 annual table, accessed 26 October 2026; our deterministic rebasing. Lines show estimates, not uncertainty intervals. The complete input, output and code are linked below.
Why the slope cannot change
Subtracting one constant from every observation preserves the difference between any two years. In our snapshot, the change from 1970 to 2025 is 1.15°C under all three references.
The same property applies to an ordinary least-squares line fitted with an intercept: a constant shift changes the intercept, not the slope. We fitted that descriptive line to the same 56 annual values, 1970 through 2025 inclusive. Every rebased series returned 0.201237°C per decade before rounding. The script checks agreement to a tolerance of one trillionth of a degree per decade.
That tiny tolerance tests the arithmetic transformation. It is not the uncertainty of the climate estimate. We have not established a warming rate with that many physically meaningful digits, estimated a confidence interval, tested acceleration, or forecast a future year. The appropriate article-level description is approximately 0.20°C per decade over this specified interval.
The reproducible core is short:
       baseline_mean = sum(reference_values) / len(reference_values)
rebased = [value - baseline_mean for value in annual_values]
The downloadable script also verifies that each reference contains 30 years, its rebased mean is effectively zero, and endpoint changes and fitted slopes remain invariant. These checks matter more than making a dramatic-looking second chart from the same numbers.
What this calculation does not settle
Changing a reference does not remove observational uncertainty. Lenssen and colleagues’ 2024 uncertainty study describes an ensemble that represents correlated uncertainty in GISTEMP. We did not run that ensemble here, so our graphic has no newly calculated confidence bands. A shift of zero leaves uncertainty to be handled; it does not make it disappear.
Nor does this calculation convert our table into an 1850–1900 estimate. GISTEMP starts in 1880. A pre-industrial comparison requires additional information and a stated conversion method. None of our three recent reference periods should be relabelled “pre-industrial,” and this exercise does not determine whether a Paris Agreement threshold has been crossed.
Finally, rebasing one dataset cannot explain every difference between independent temperature products. Their observations, coverage and processing can differ. Our claim is narrower and directly testable: subtracting a constant from the same annual series changes its level, not its year-to-year differences or fitted slope.
Reproduce it, then read the next headline differently
Download the frozen NASA input, standard-library Python script, calculated annual series and results with validation checks. Put the input and script together and run python analyze.py. No API key or paid software is required.
Dataset citation: GISTEMP Team, 2026, GISS Surface Temperature Analysis, version 4, NASA Goddard Institute for Space Studies, accessed 26 October 2026. Method and uncertainty reference: Lenssen et al. (2024), A GISTEMPv4 observational uncertainty ensemble, DOI 10.1029/2023JD040179.
The next time two warming numbers look incompatible, check the label after “above.” Then check the year or month, the geographical scope and the underlying product. As in our flood-probability analysis, the useful first step is understanding precisely what the reported number measures.
Cover: a conceptual thermometer illustration assembled with separately drawn typography and the publication’s star. Its movable scales are a visual metaphor, not a measuring instrument or a representation of the data used in this analysis.