What can a tiny dip in starlight tell us about a planet?
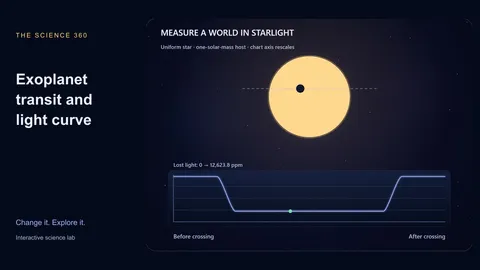
A transiting planet hides a small part of its star and causes a repeating brightness dip. A larger planet blocks more area; a larger star makes the same planet’s signal smaller.
This simulator calculates the exact overlap of two circular disks for a uniformly bright star. The light curve and sky view share the same projected position. The duration readout uses a circular orbit around a one-solar-mass host.
Read the companion article for a worked investigation, or continue with planet size comparison.
What to look for
- A full Earth–Sun transit has about 84 ppm depth in this model.
- Doubling planet radius multiplies a fully contained transit depth by four.
- Grazing or non-transiting geometries break the simple squared-radius depth interpretation.
Experiments to try
Load a complete preset, predict what will change, then adjust one control and compare the live measurements.
Jupiter-size planet
Guided experimentA roughly Jupiter-size disk blocks about one percent of a Sun-size star’s light in a non-grazing transit. Follow the ingress, flat bottom and egress on the graph while the planet moves across the star.
Earth-size signal
Guided experimentAn Earth-size disk blocks only about 84 parts per million of this uniform Sun-size star. The chart rescales vertically so the tiny dip remains visible. Read the ppm axis before comparing the apparent depth on screen.
Grazing transit
Guided experimentThe planet clips the stellar edge, producing a shallower, more rounded dip. Increasing impact above one plus the radius ratio removes the transit completely, even though the planet still exists.
Mystery planet
Guided experimentThe planet disk is hidden and the observed curve belongs to a fixed synthetic planet. Adjust your radius estimate until the dashed curve matches the observed depth. Use the known stellar radius and the square root of the measured depth to calculate an answer.
Compare the cases
| Radius ratio | Full-transit depth | Parts per million |
|---|---|---|
| 0.00916 (Earth / Sun) | 0.0084% | 84 |
| 0.05 | 0.25% | 2500 |
| 0.1 | 1% | 10000 |
Rounded values and classifications refer to the model and assumptions on this page.
How the model works
The brightness calculation integrates the overlapping area of the planet and stellar disks. For a central passage, maximum area is πRp². For a grazing passage, only a lens-shaped portion overlaps.
Kepler’s third law sets a/R★ from orbital period for a fixed one-solar-mass host. The first-to-fourth contact duration uses the circular-orbit chord formula. Playback advances projected position uniformly across the chord for readability.
What the model leaves out
- Uniform stellar disk: no limb darkening, starspots or detector noise.
- Circular orbit and fixed one-solar-mass host; selected radius is independent of stellar evolution.
- Playback speed is illustrative. Repeated transits, false-positive tests and confirmation are not simulated.
Common misconceptions
A single brightness dip is not a confirmed planet. Eclipsing stars and instrumental effects can mimic a signal. Real searches test recurrence and alternative explanations.
Frequently asked questions
Does the dip reveal a planet’s mass?
Not by itself. The depth mainly gives a radius ratio under the model assumptions. Mass usually needs other evidence, such as radial velocities or timing variations.
Why does the Earth dip look as tall as Jupiter’s?
The vertical axis automatically rescales. Compare the depth in ppm rather than the drawn height.
Keep learning
How a dip in starlight reveals an exoplanet’s size
Infer a planet-to-star radius ratio from a transit light curve, compare Earth and Jupiter signals, and explore why grazing transits need more care.